Track your productive time in TimeCaptis. Keep your projects on track and on budget. Refer to the detailed instructions in the step by step guide below.
1. Sign in to your TimeCaptis Account
2. Click on the ‘Time Report’ link from the selected team from the list of teams appearing on the left sidebar menu. The 'My Personal' team will display only your personal data you have entered in that team, which can not be shared.
Figure 1
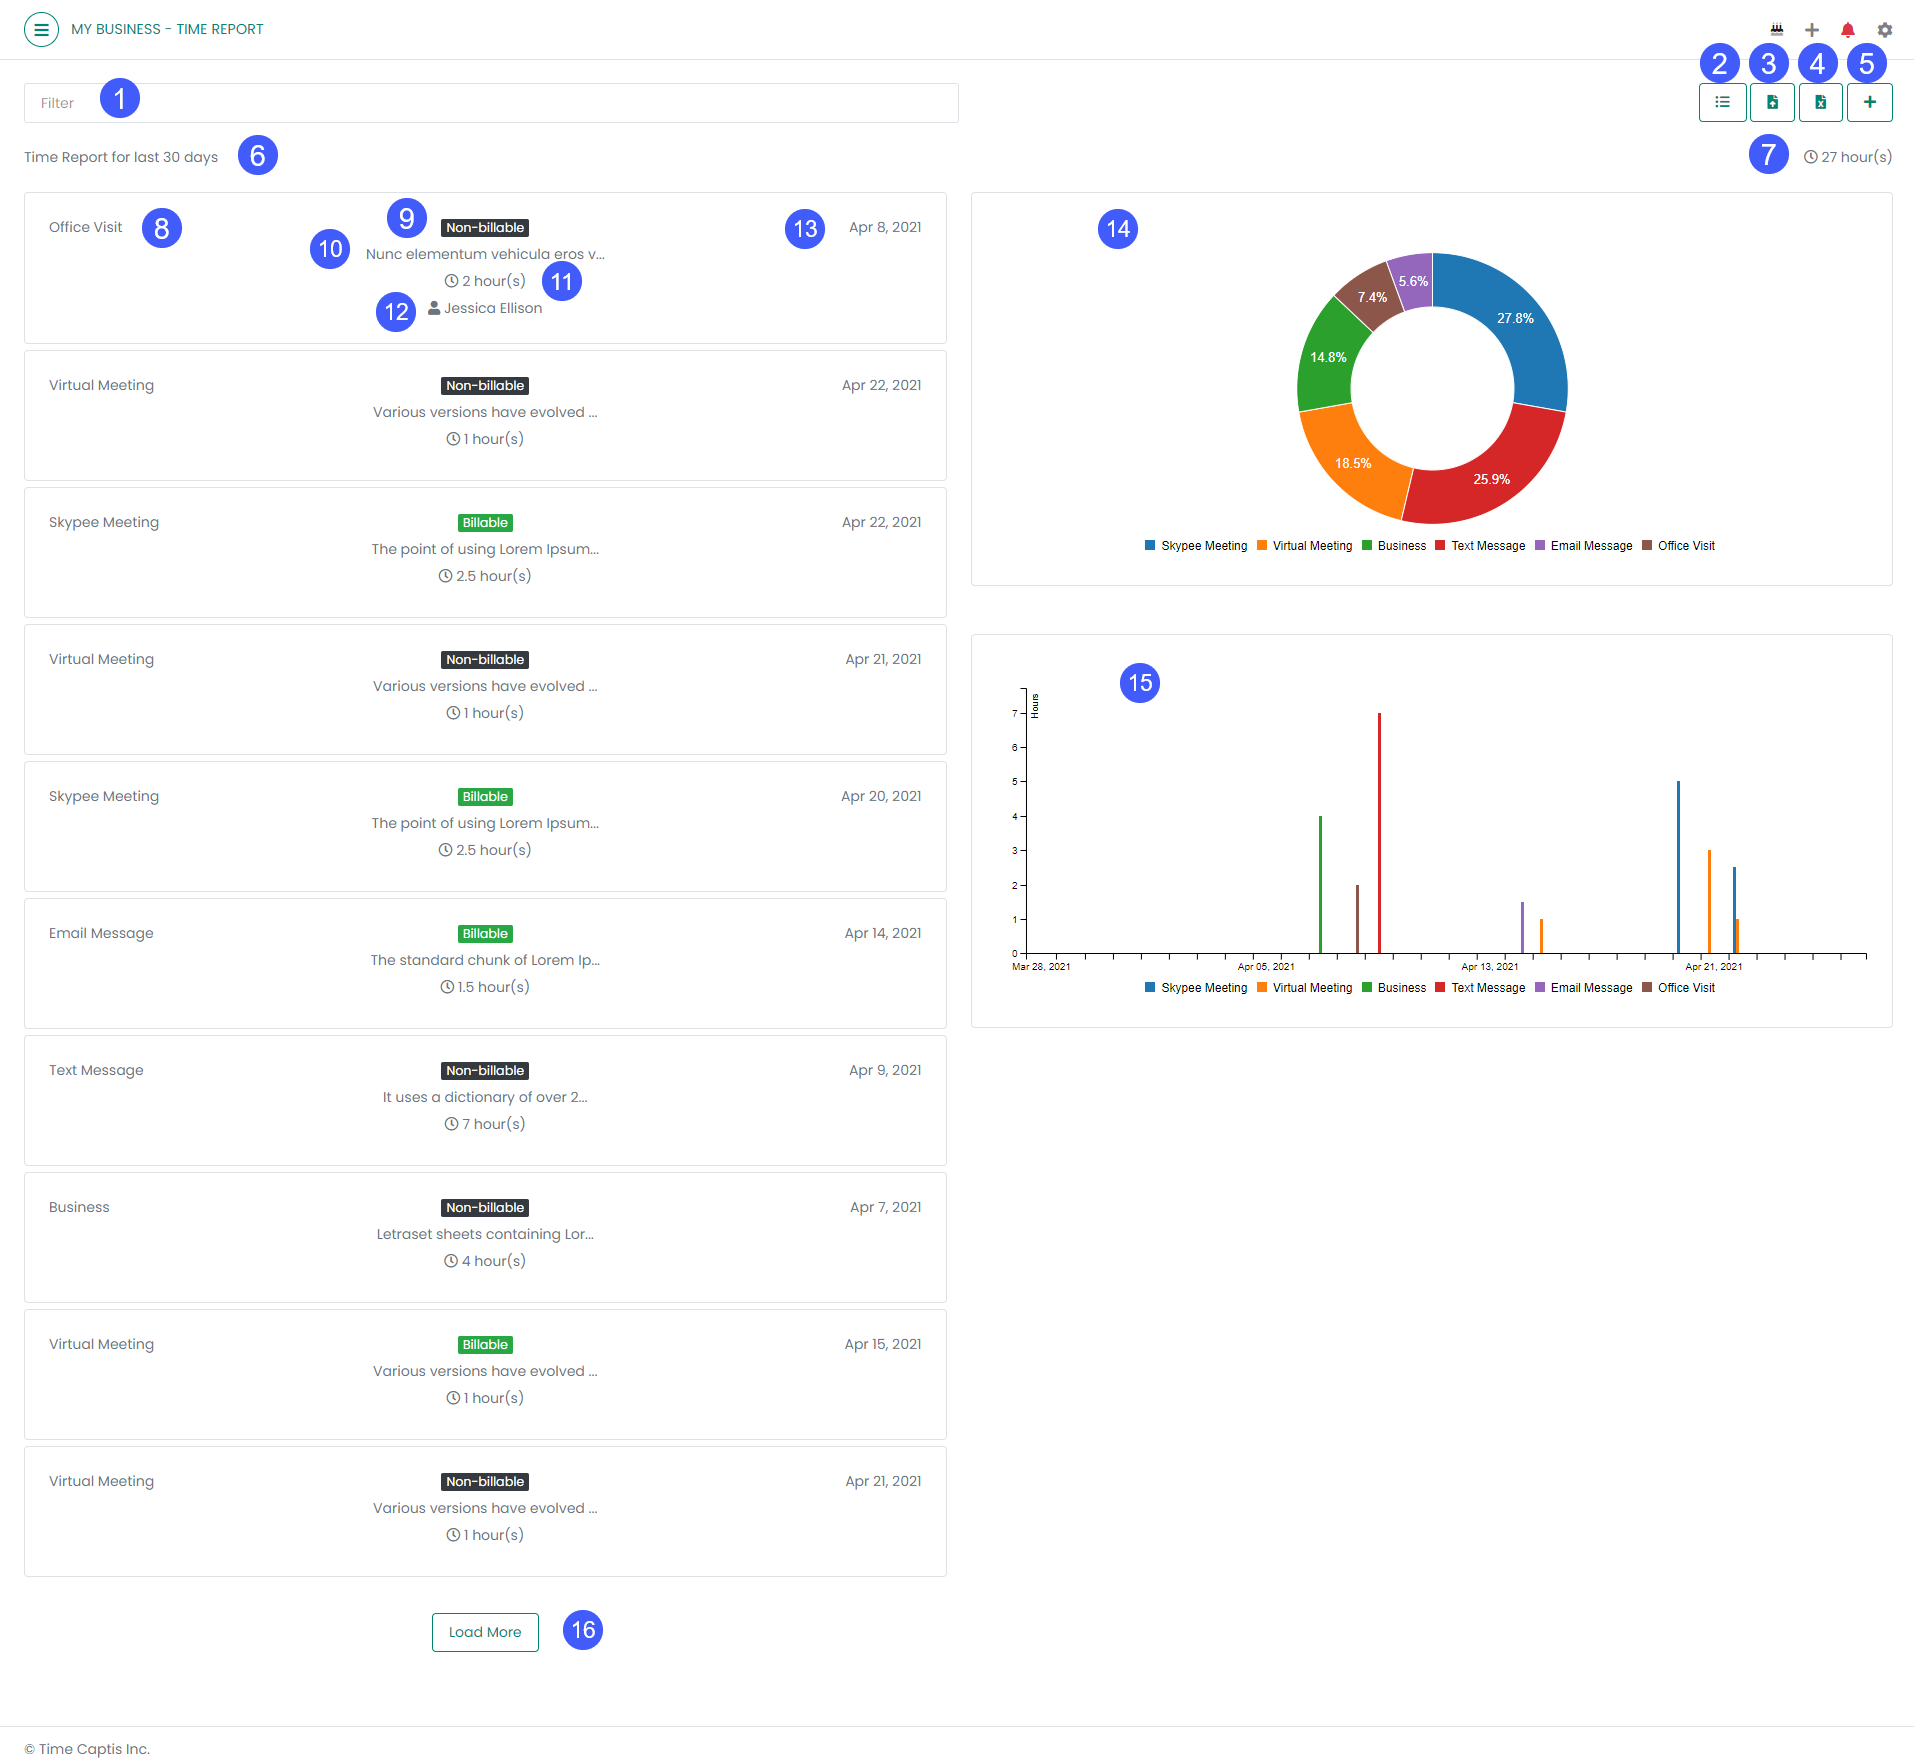
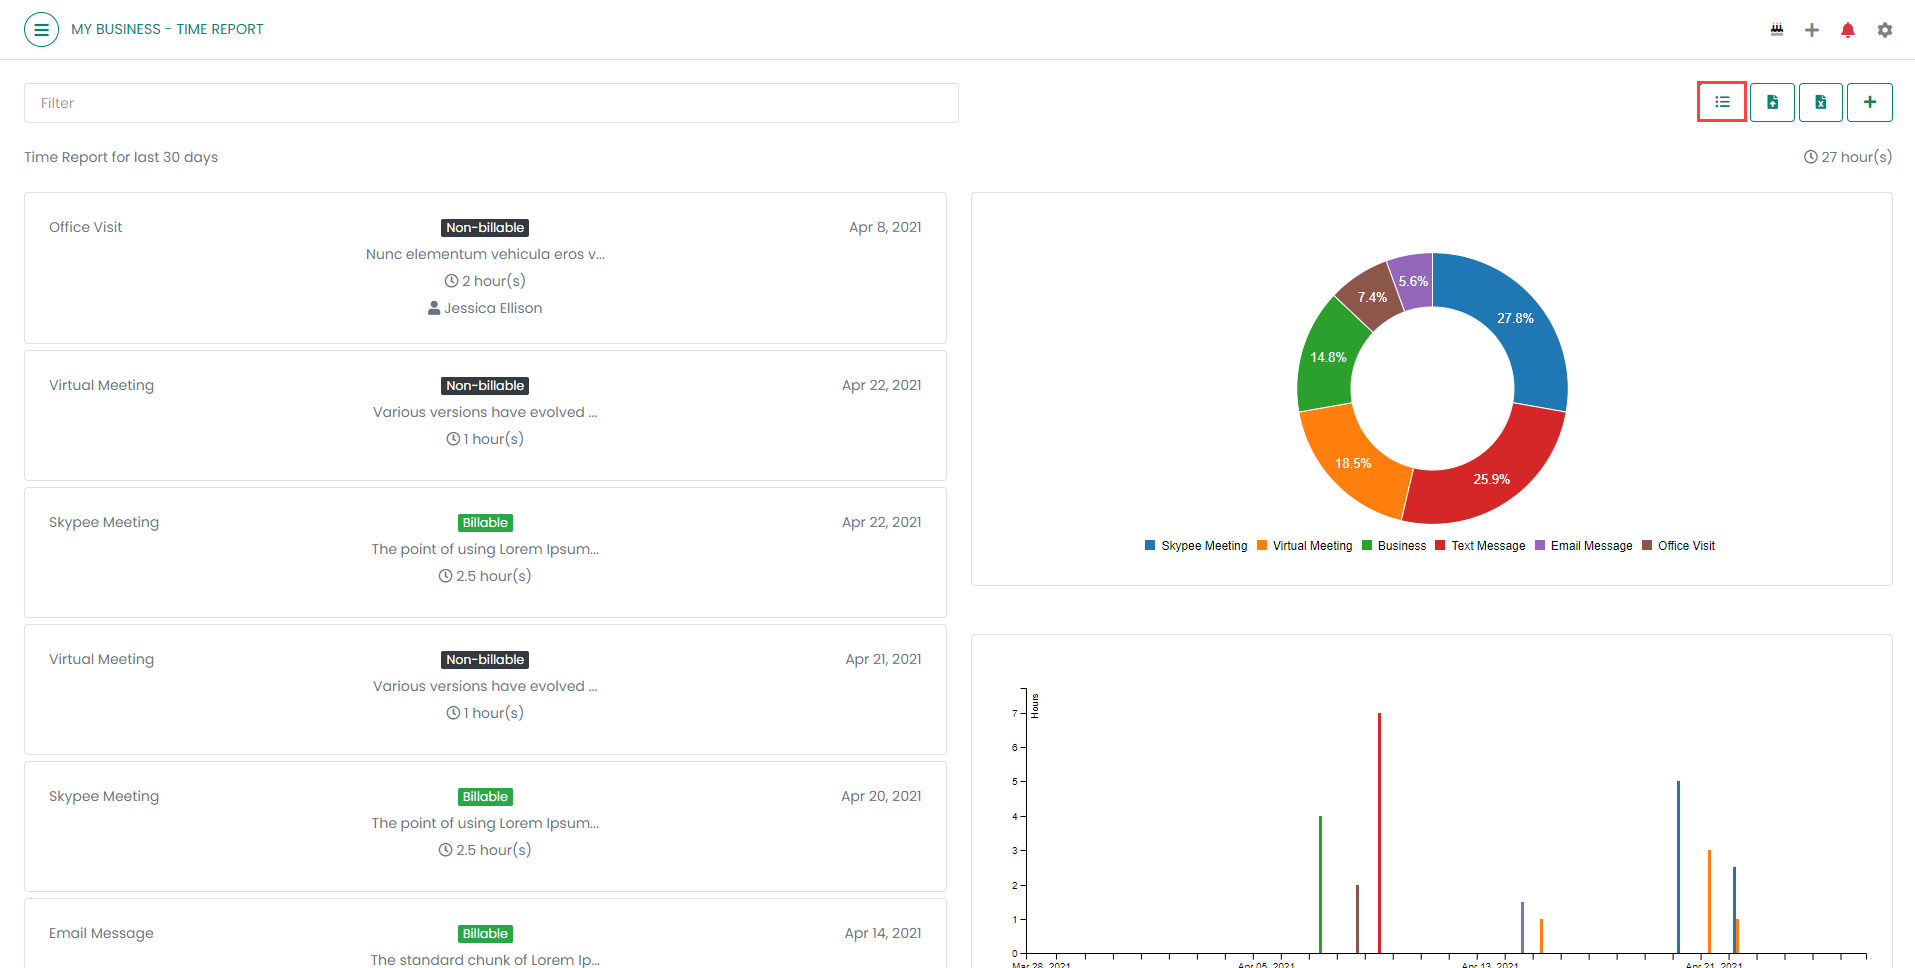
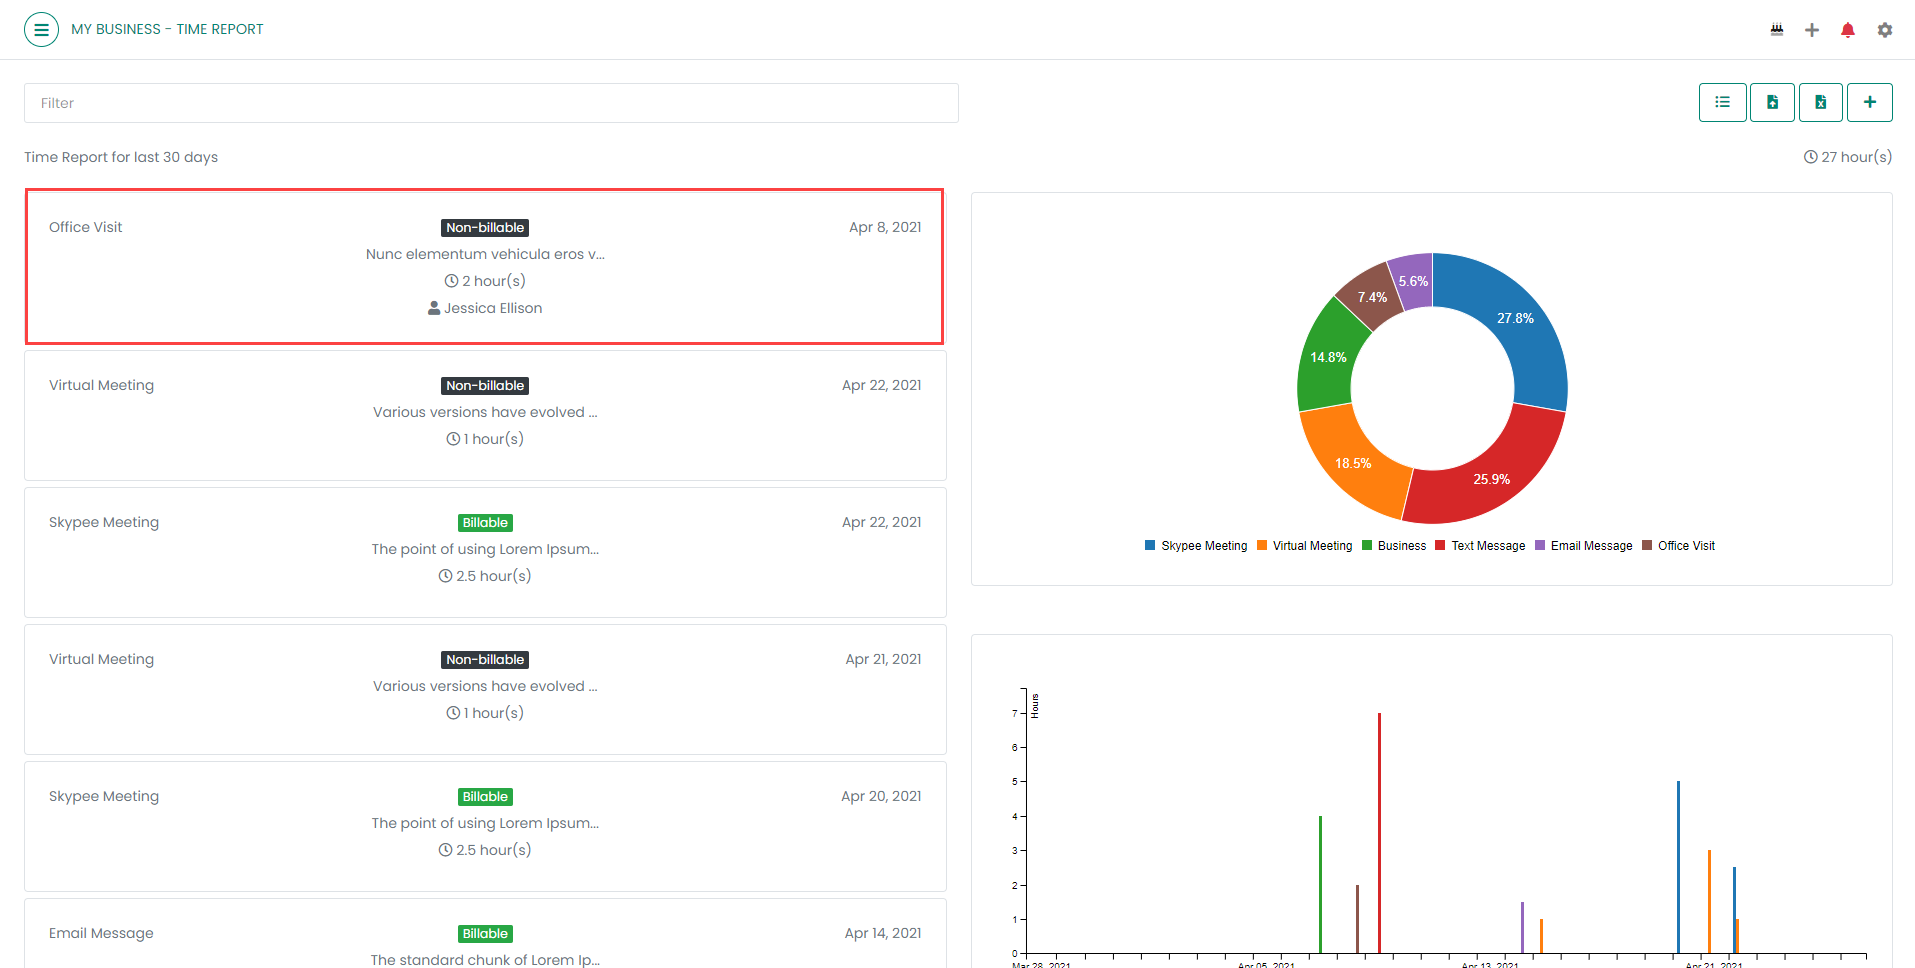
3. Upon doing so, you can view your Time Report, Time Spent chart and Time Spent graph for the last 30 days as shown in Figure 2. Each step shown in Figure 2 is explained in the below table.
Figure 2
Sl. No.
Name
Description
1
Filter
Click to filter time report
2
Category
Click to view all the categories of all the Teams the subscriber is associated with
3
Import Records
Click to import time reports for the specific team
4
Export To Excel
Click to export the time report
5
Add Time
Click to add time
6
Time Report for last 30 days
The time report will appear for the last 30 days by default. But, after filtering the time reports without entering any parameters in Date fields, the time report will display for 1 year taking the current date as the End Date
7
Total Hour(s)
The total time added in the time report
8
Category
The category chosen for the added time
9
Is Billable?
Whether the added time is billable or not
10
Comment
The comment added while adding time
11
Total Time
The total time entered while adding time
12
Contact Name
The contact name added in the item for which the time is added
13
Date
The date on which the time is added
14
Time Spent Pie Chart
The pie chart showing the total time spent for the last 30 days
15
Time Spent Graph
The graph showing the total time spent for the last 30 days
16
Load More
Click to view the next 10 records (if available)
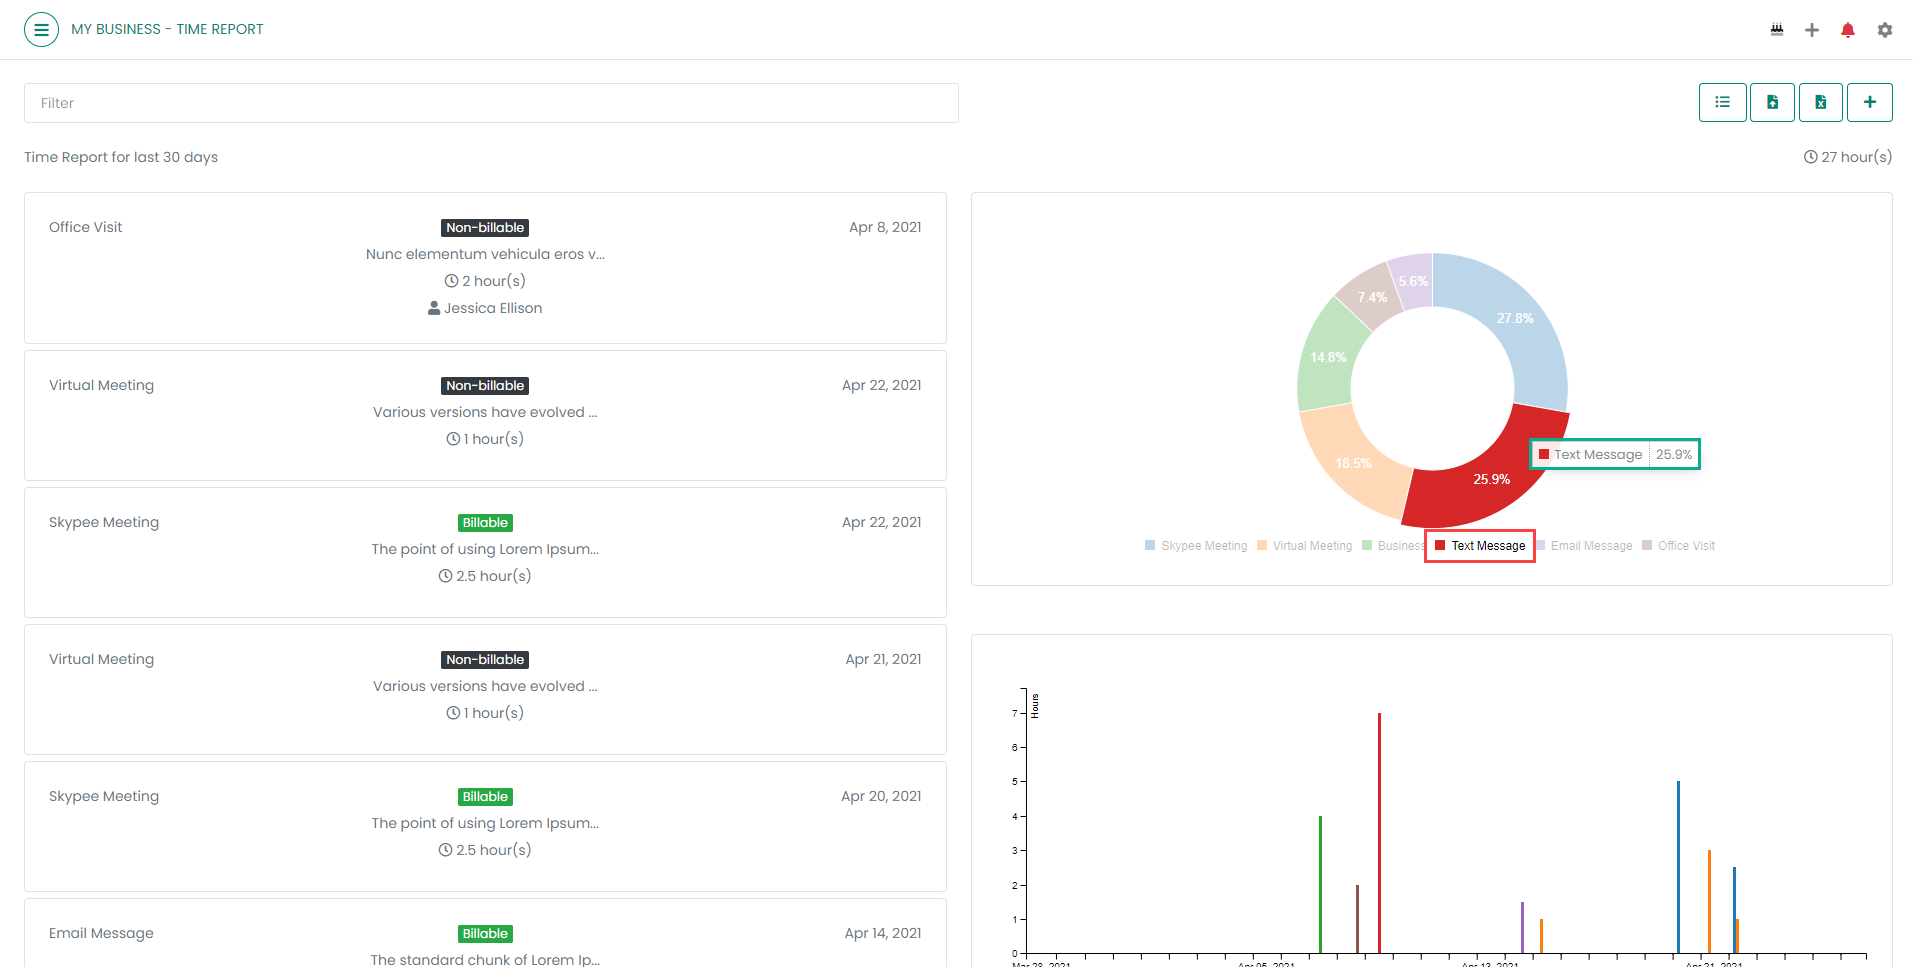
4. By mouse hovering on any section of the pie chart, the category name with percentage will appear as shown in Figure 3.
Figure 3
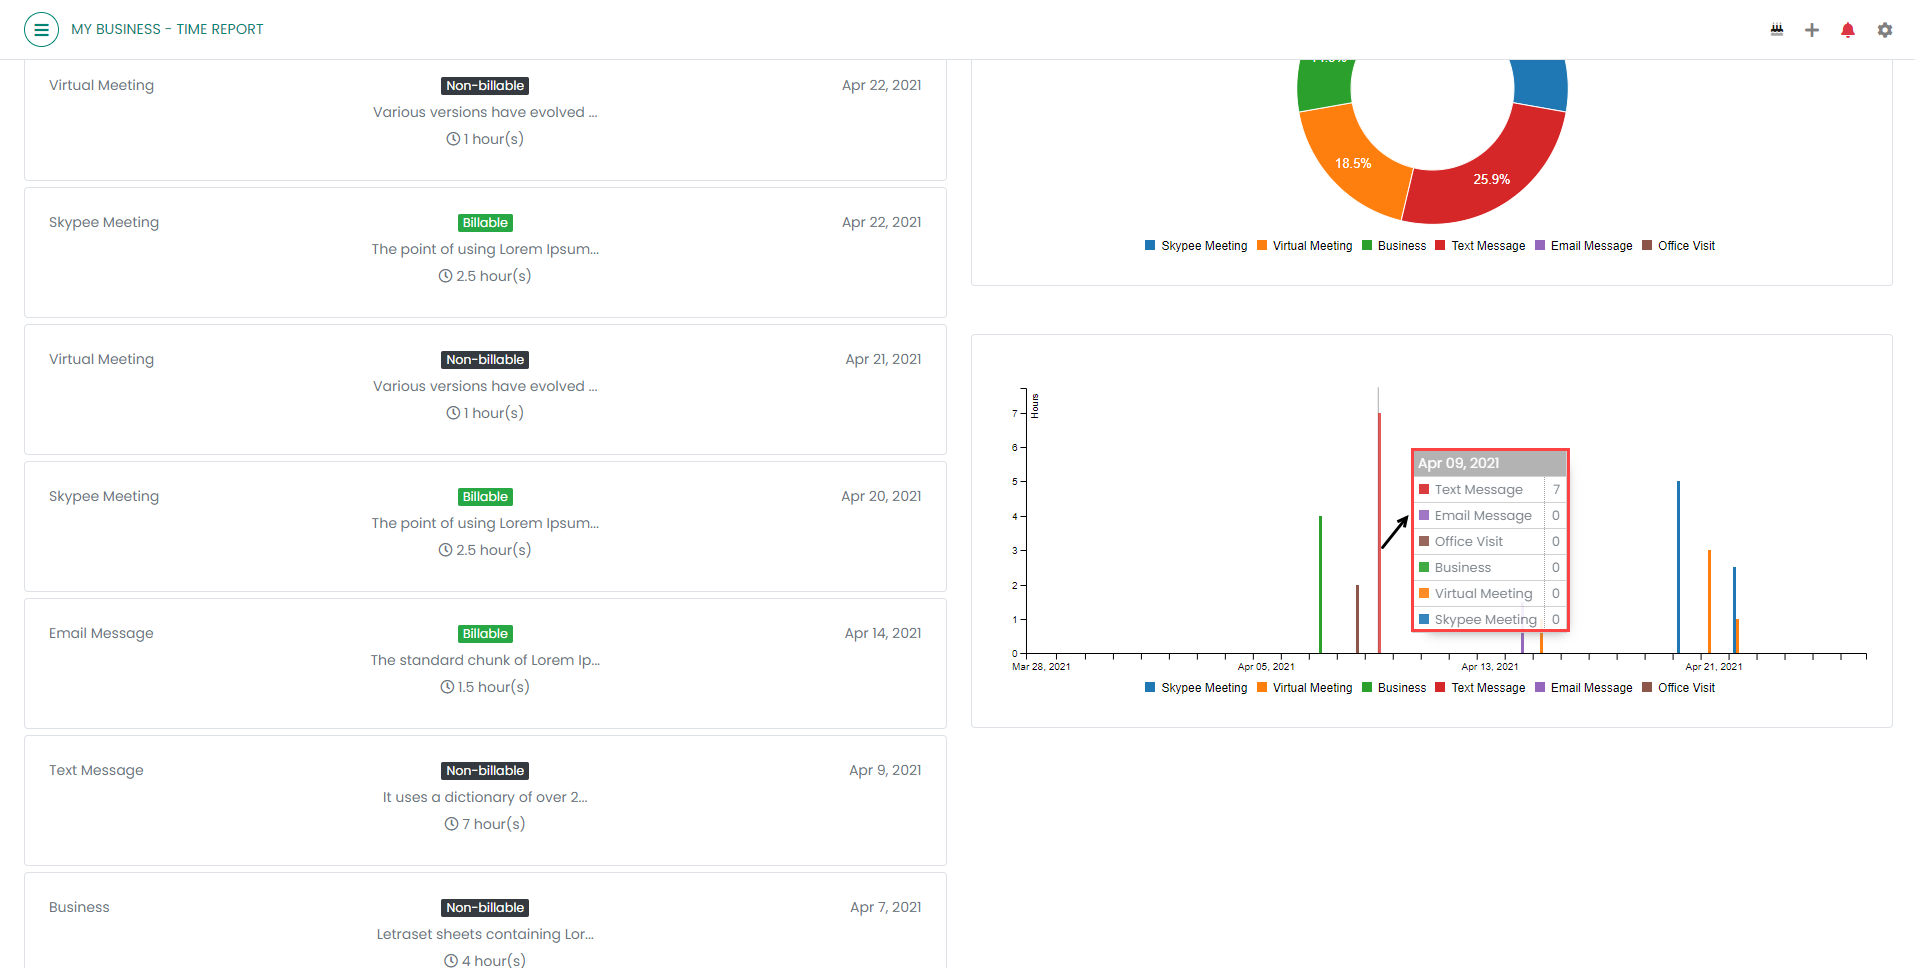
5. By mouse hovering on the bars of a particular date, the details of time added for that date will appear with a box as shown in Figure 4.
Figure 4
6. To view the categories of the Team, click on the 'Categories' button appearing on the Time Report page as shown in Figure 5.
Figure 5
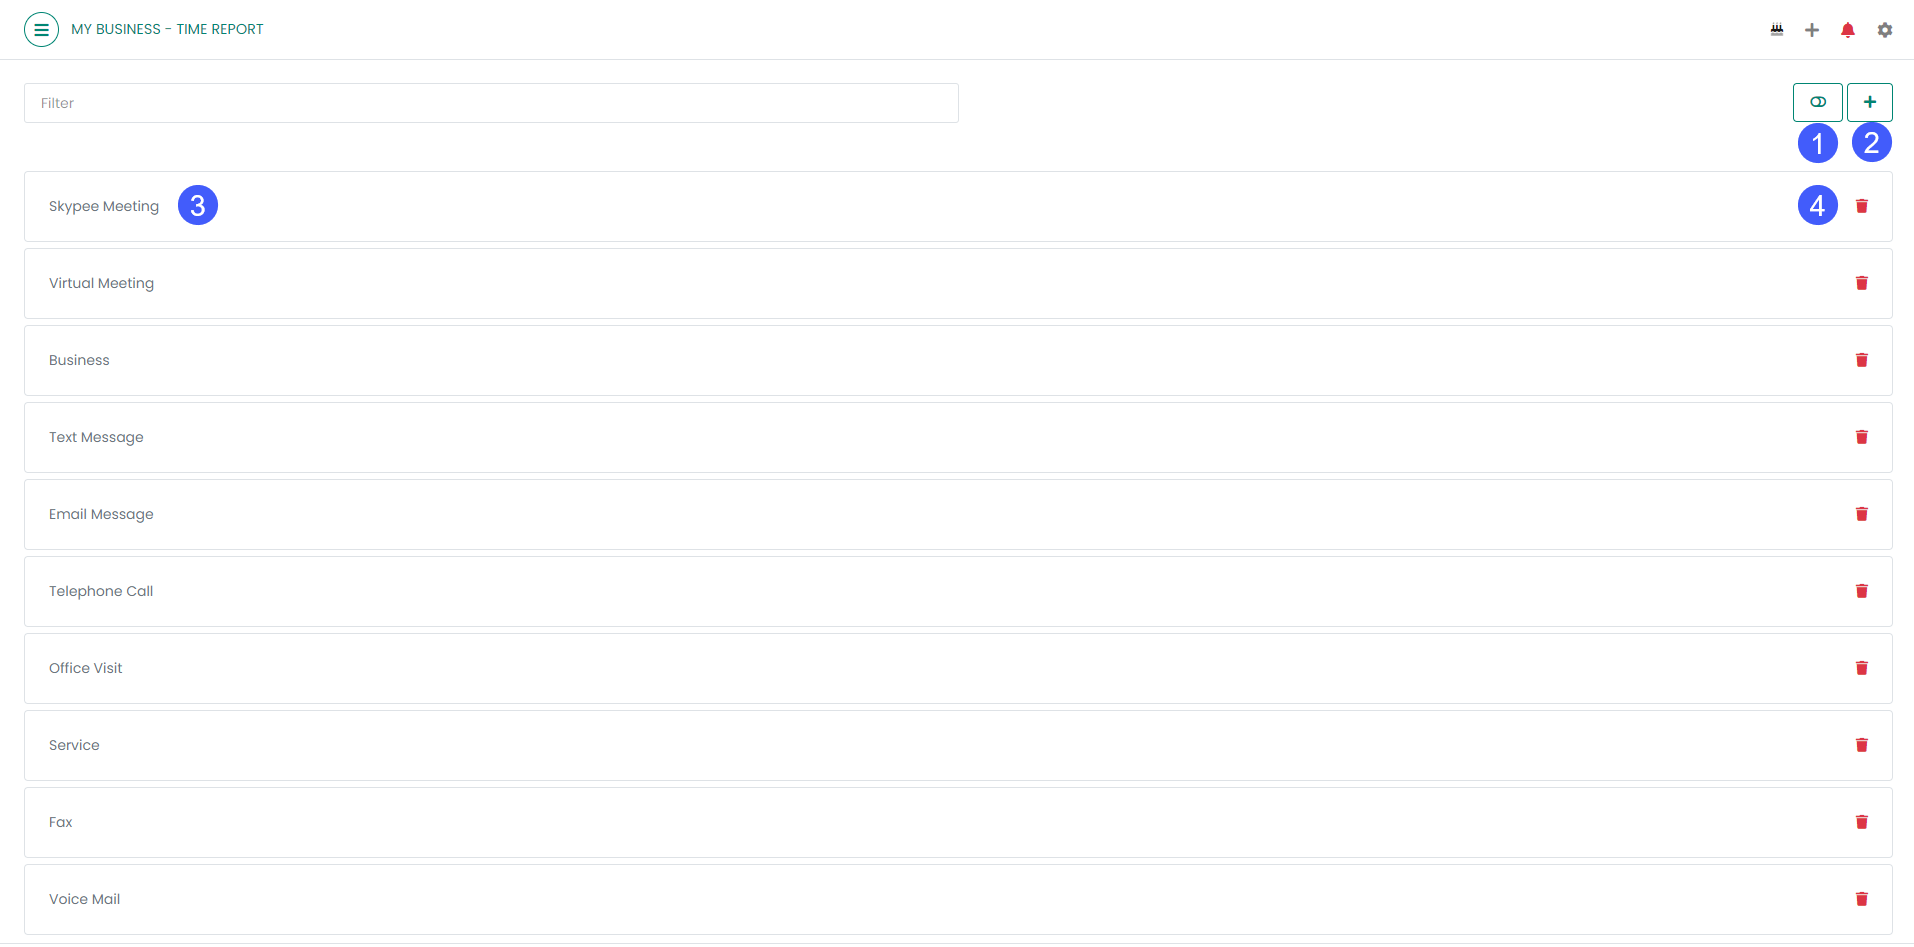
7. Upon doing so, the Category page will appear as shown in Figure 6. Each step shown in Figure 6 is explained in the below table.
Figure 6
Sl. No.
Name
Description
1
List View
Click to return to the time report page
2
Add Category
Click to add category for this team for which the user should have the permission
3
Category
The category name of the team
4
Delete Category
Click to delete the category. For a specific team, the delete category button will not appear to any of the team users except the admin
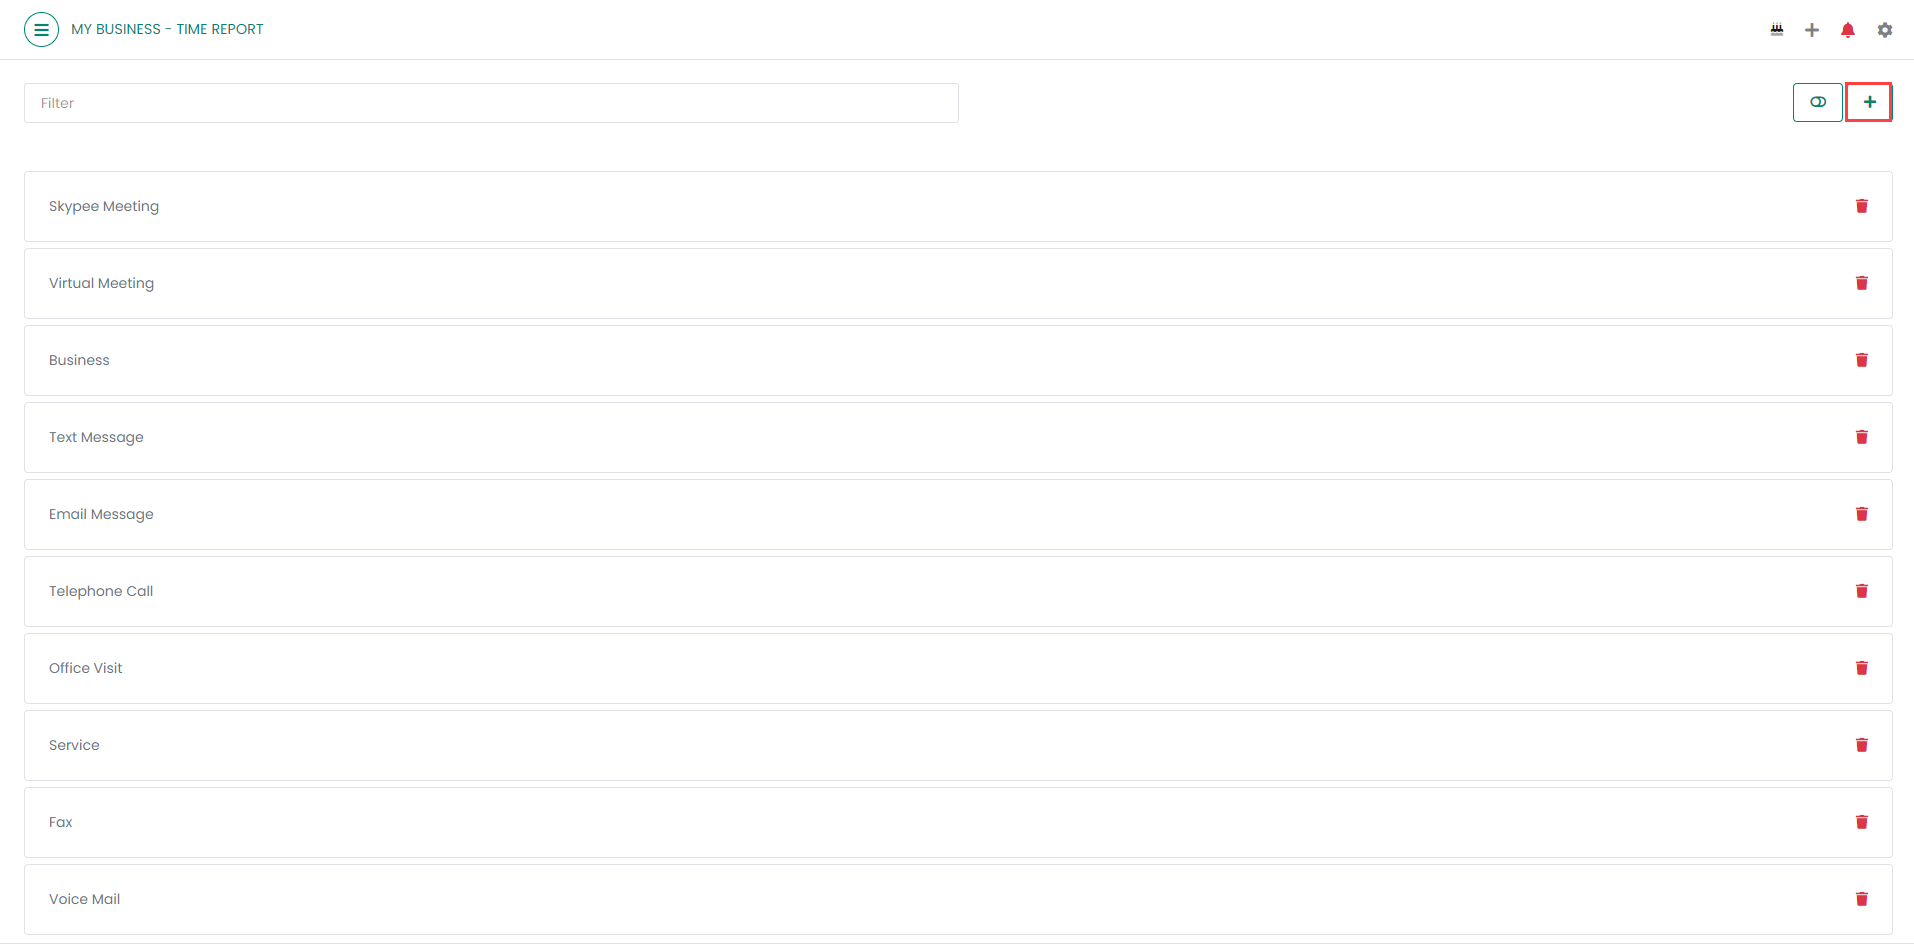
8. To add a category, click on the 'Add Category' button as shown in Figure 7.
Figure 7
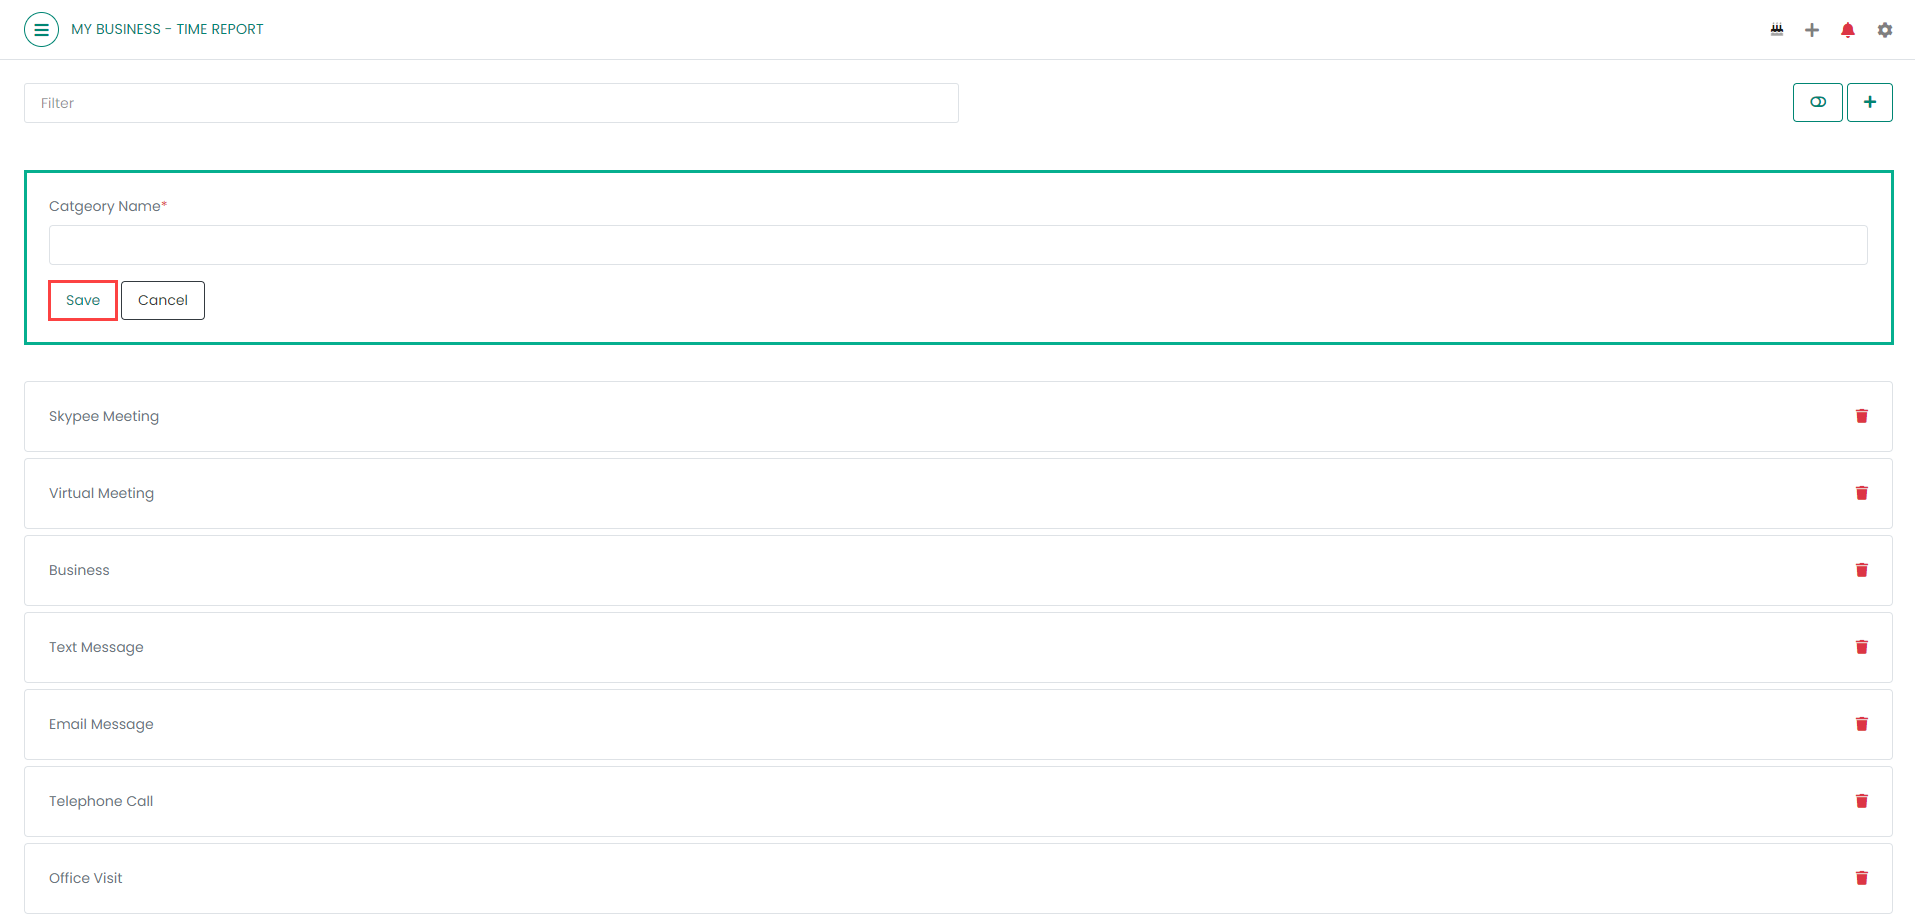
9. Upon doing so, the 'Category Name' field will appear on the page. Enter the name of the category and click on the Save button as shown in Figure 8.
Figure 8
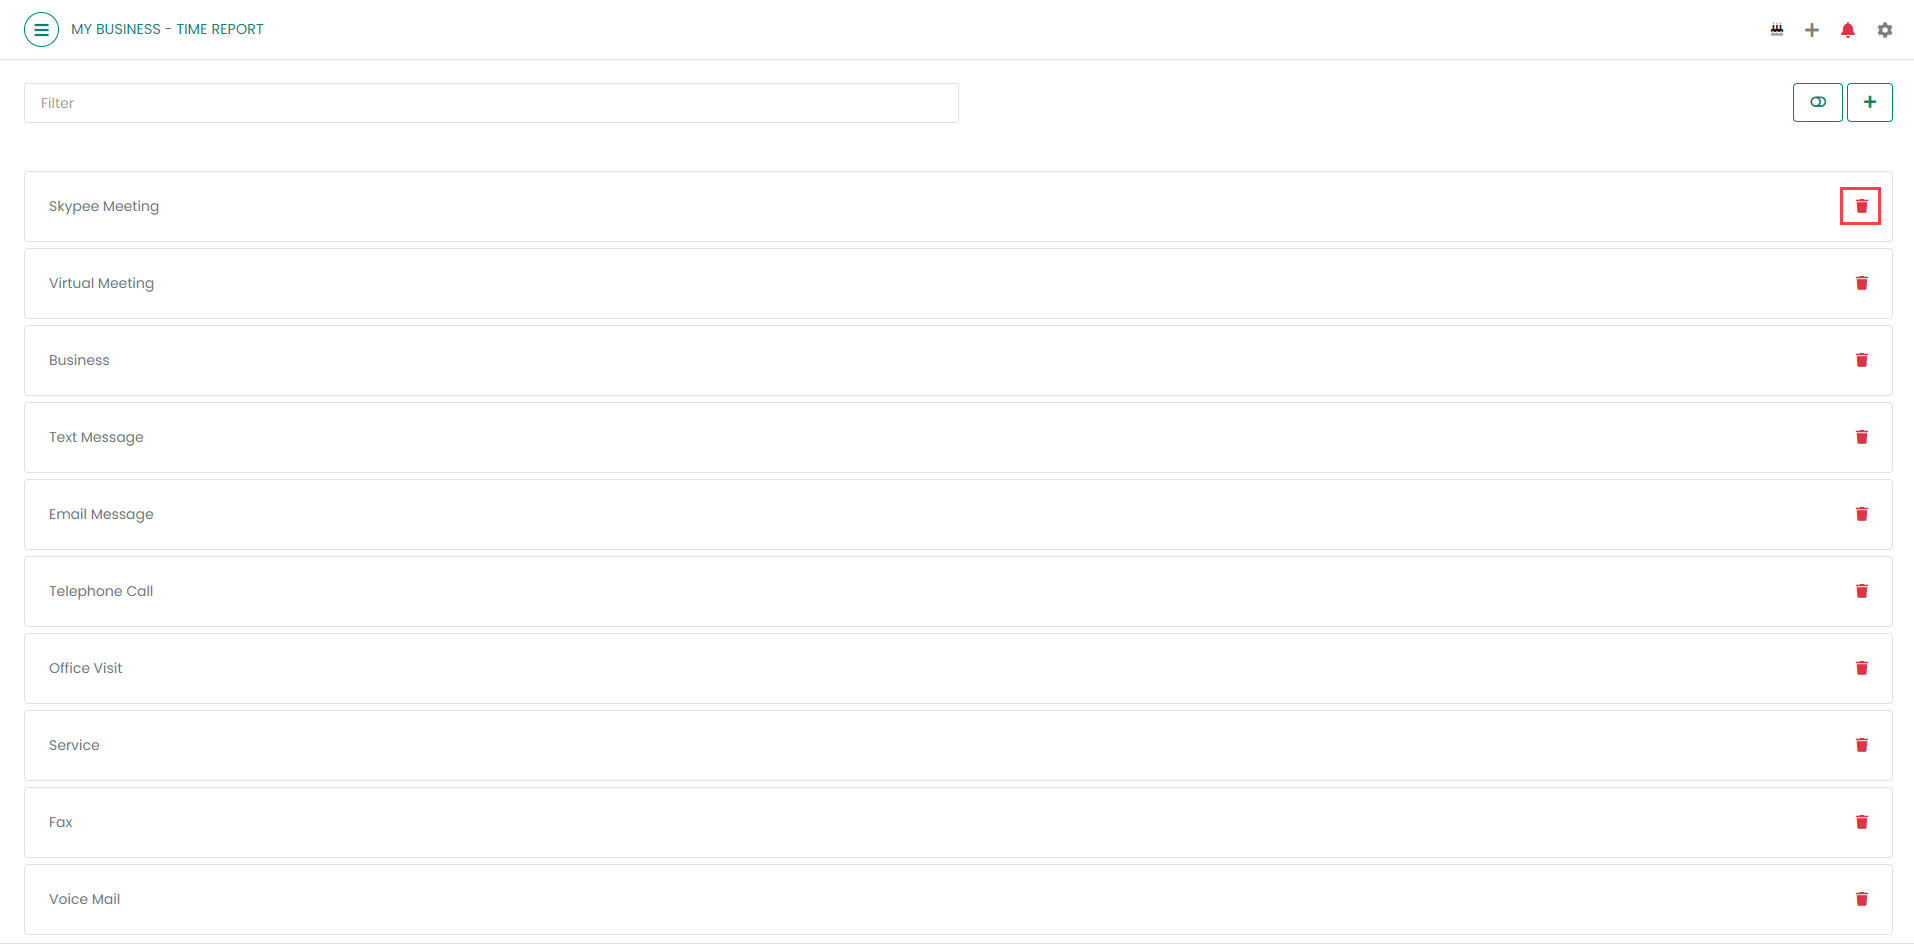
10. To delete a category, click on the 'Delete' button as shown in Figure 9.
Figure 9
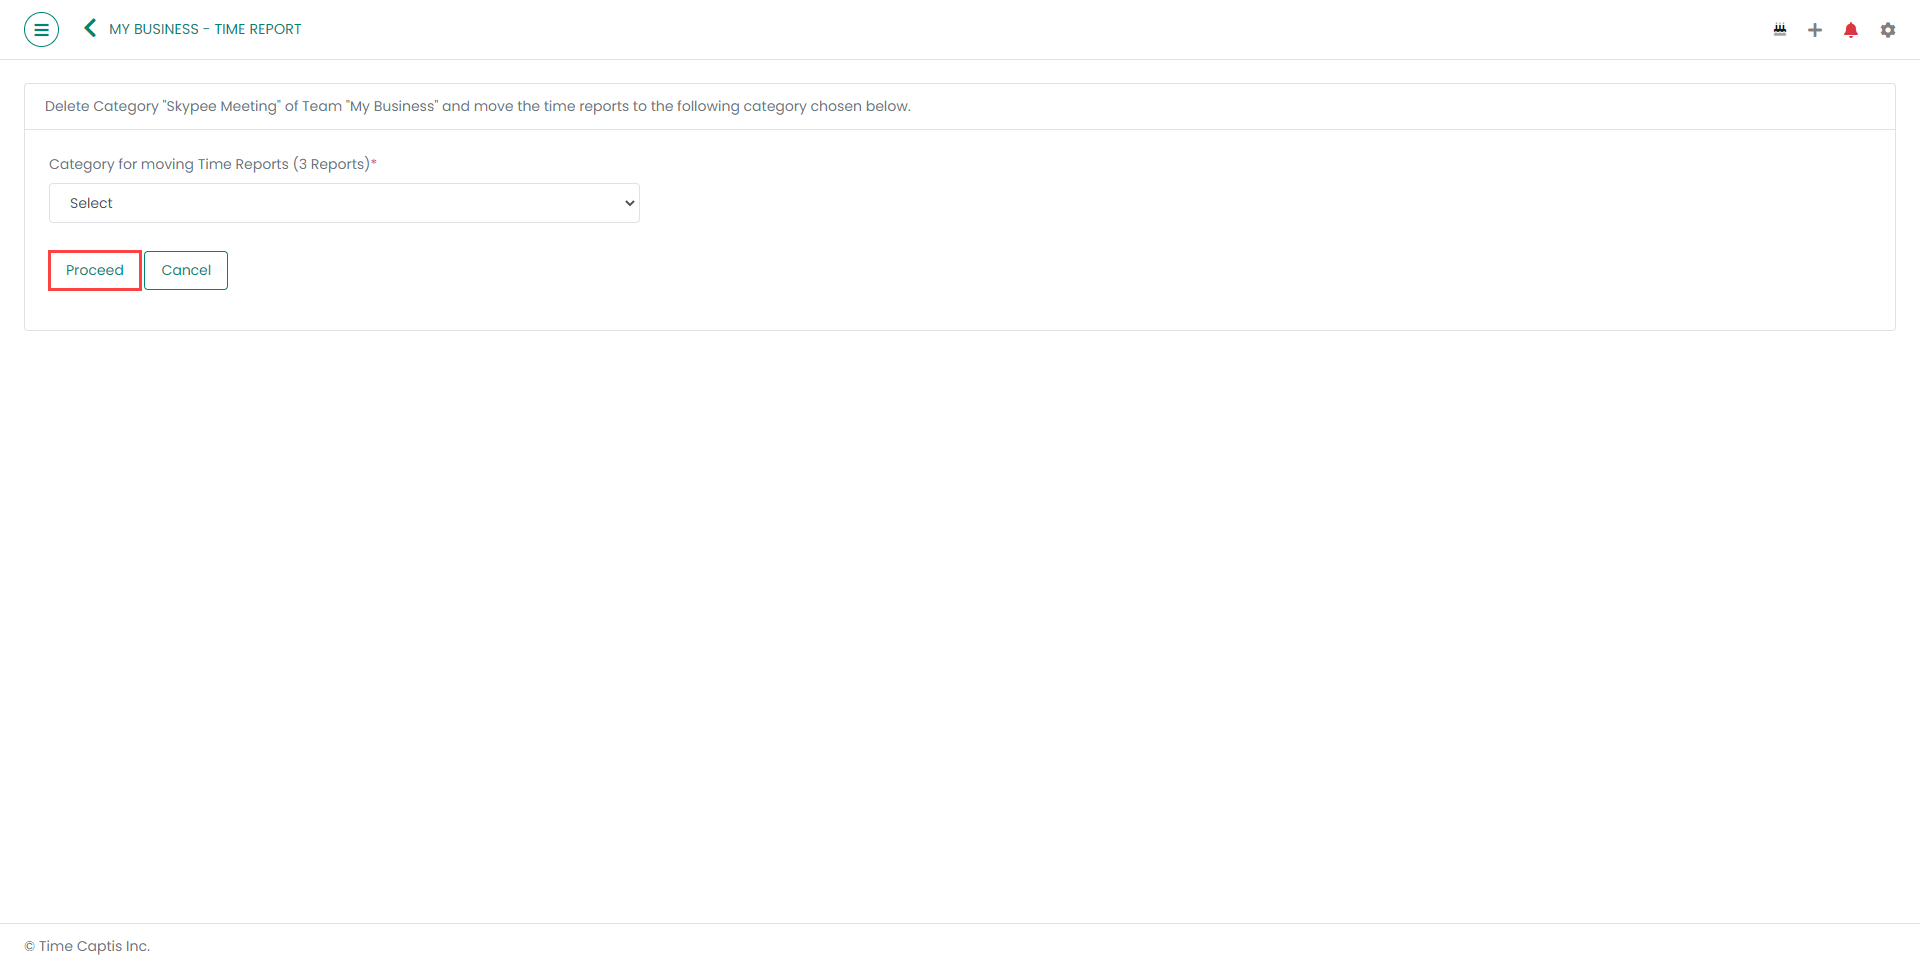
11. Upon doing so, a drop-down list will appear on a page to select another category or to create a new category to move the time reports of the selected category to be deleted before deleting that category as shown in Figure 10. Then by clicking on the 'Proceed' button, the selected category will be deleted.
Figure 10
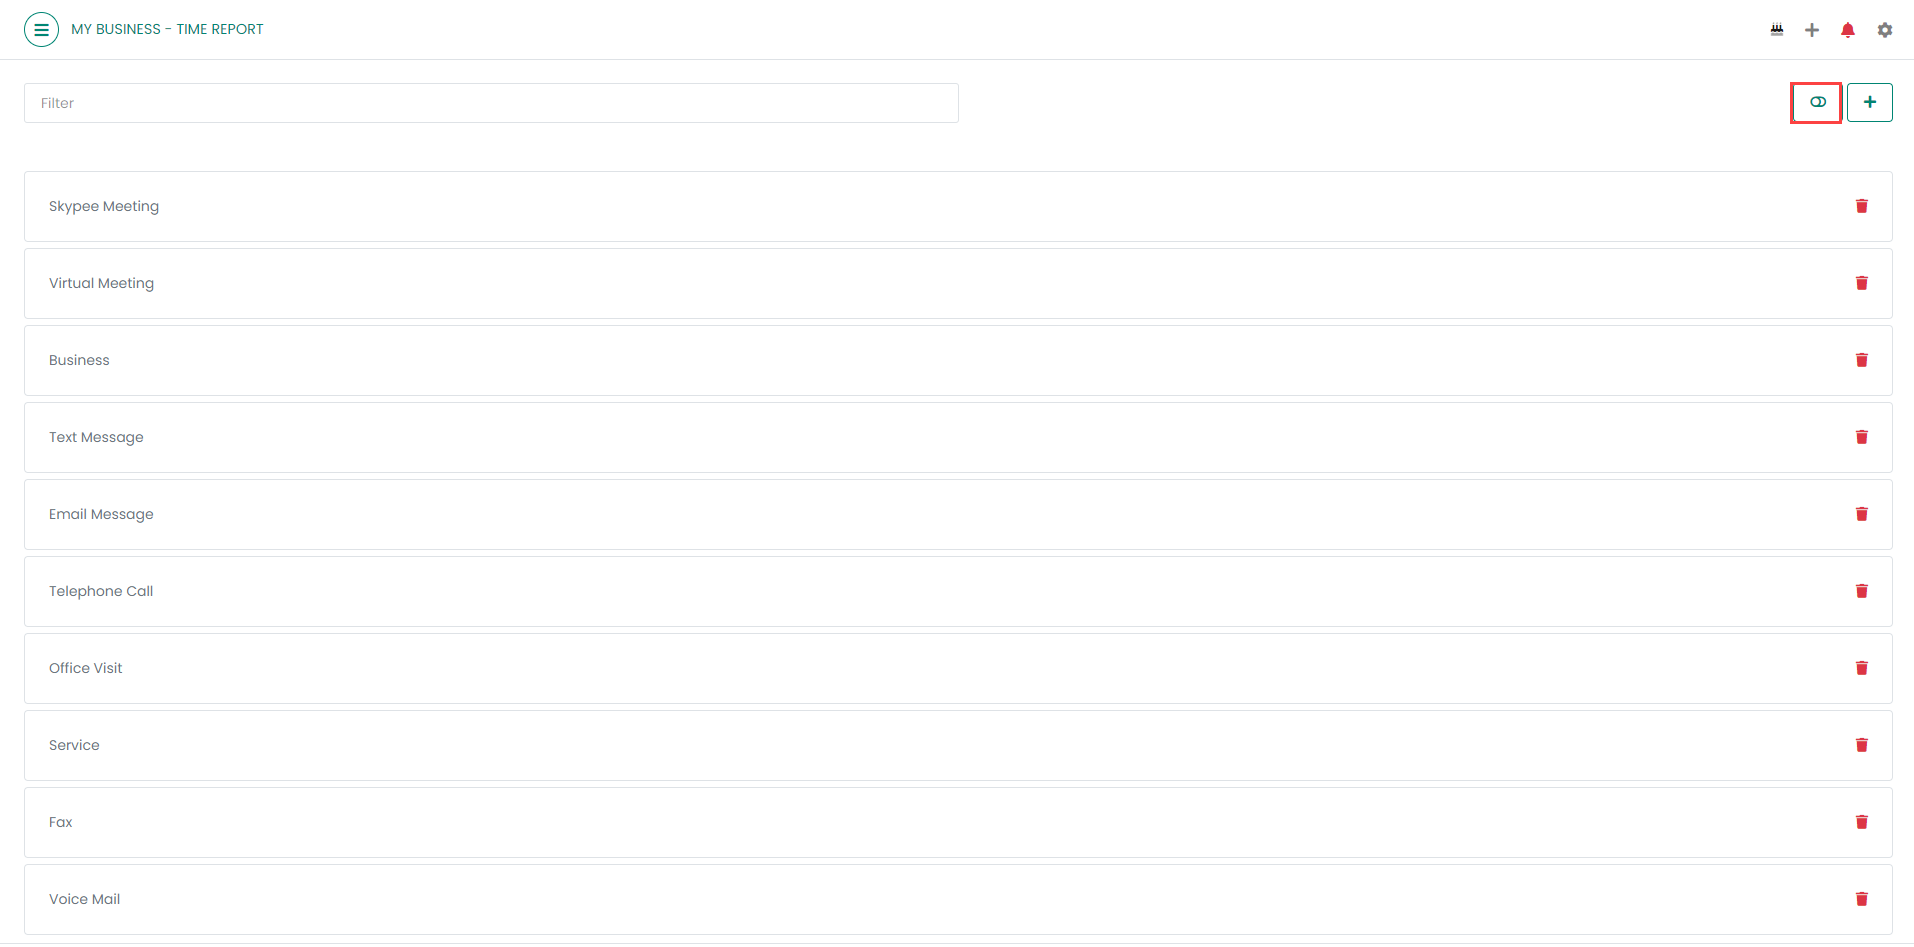
12. To return to the home page of Time Report, click on the 'List View' button appearing on the category page as shown in Figure 11.
Figure 11
13. To import Time Reports, click on the 'Import Records' button as shown in Figure 12.
Figure 12
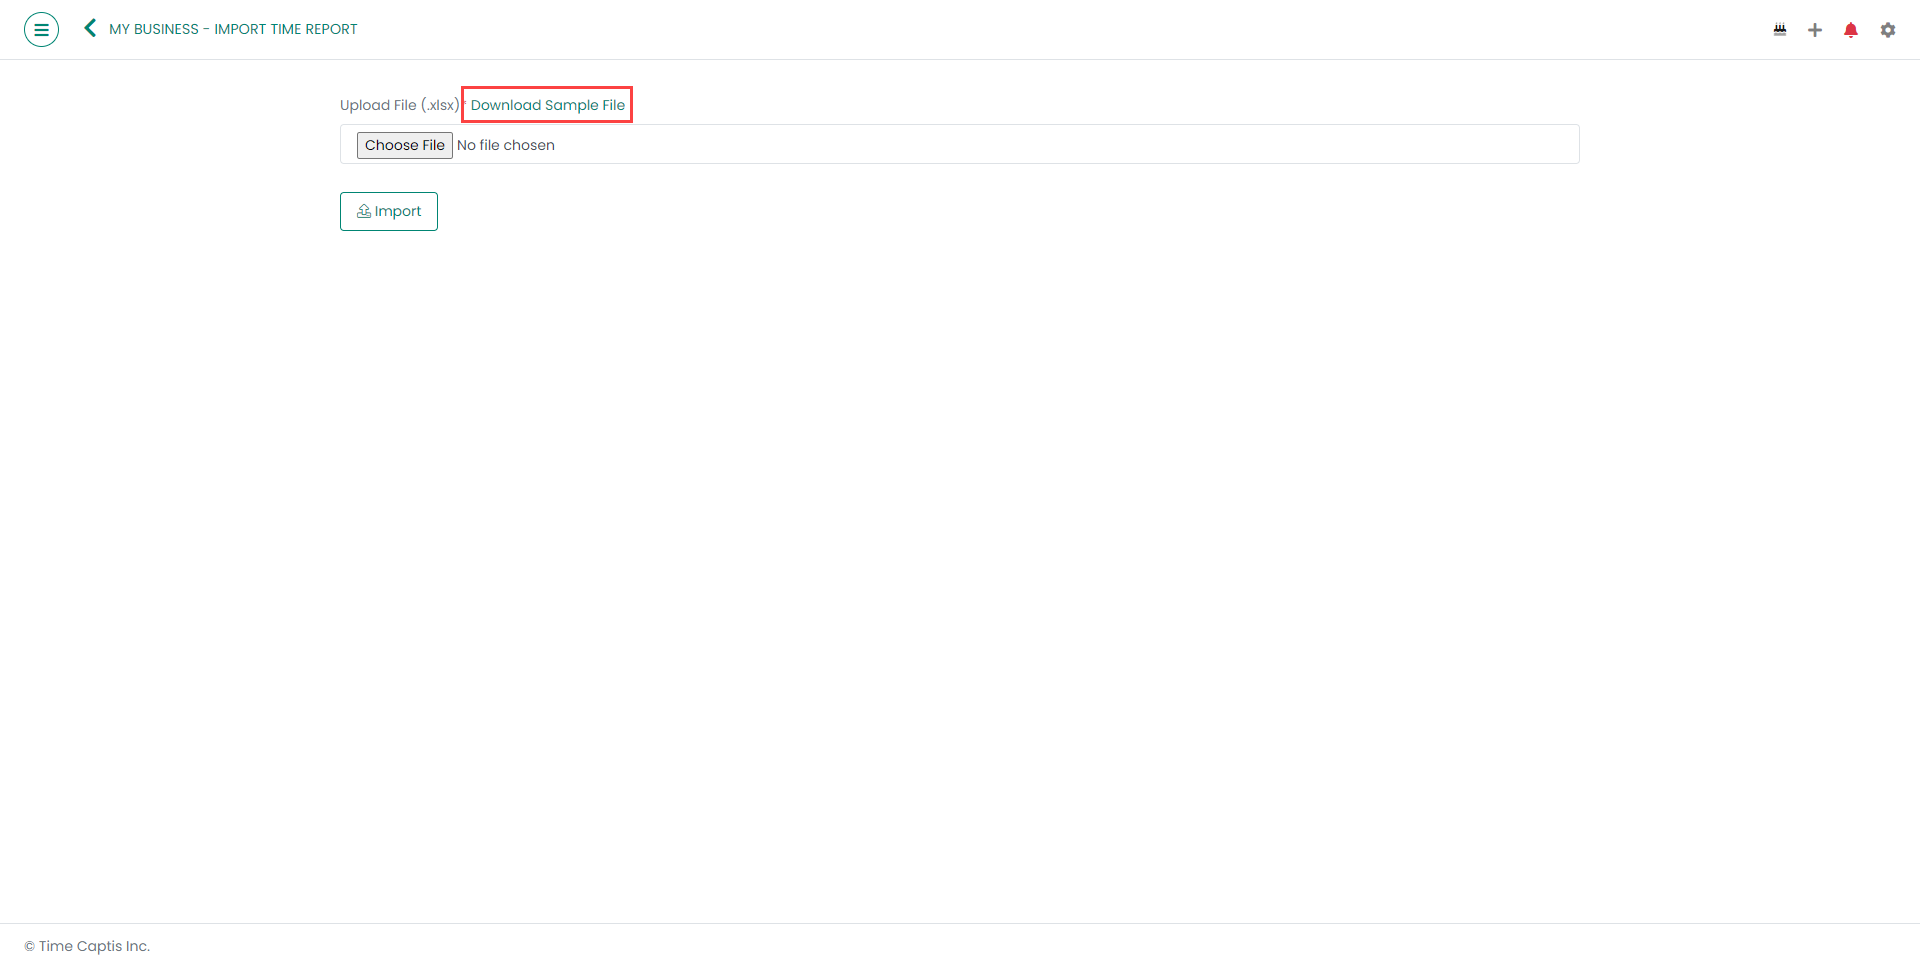
14. Upon doing so, the 'Import Time Report' page will appear as shown in Figure 13. Click on the 'Download Sample File' link to download the sample '.xlsx' file to your local system as shown in Figure 13.
Figure 13
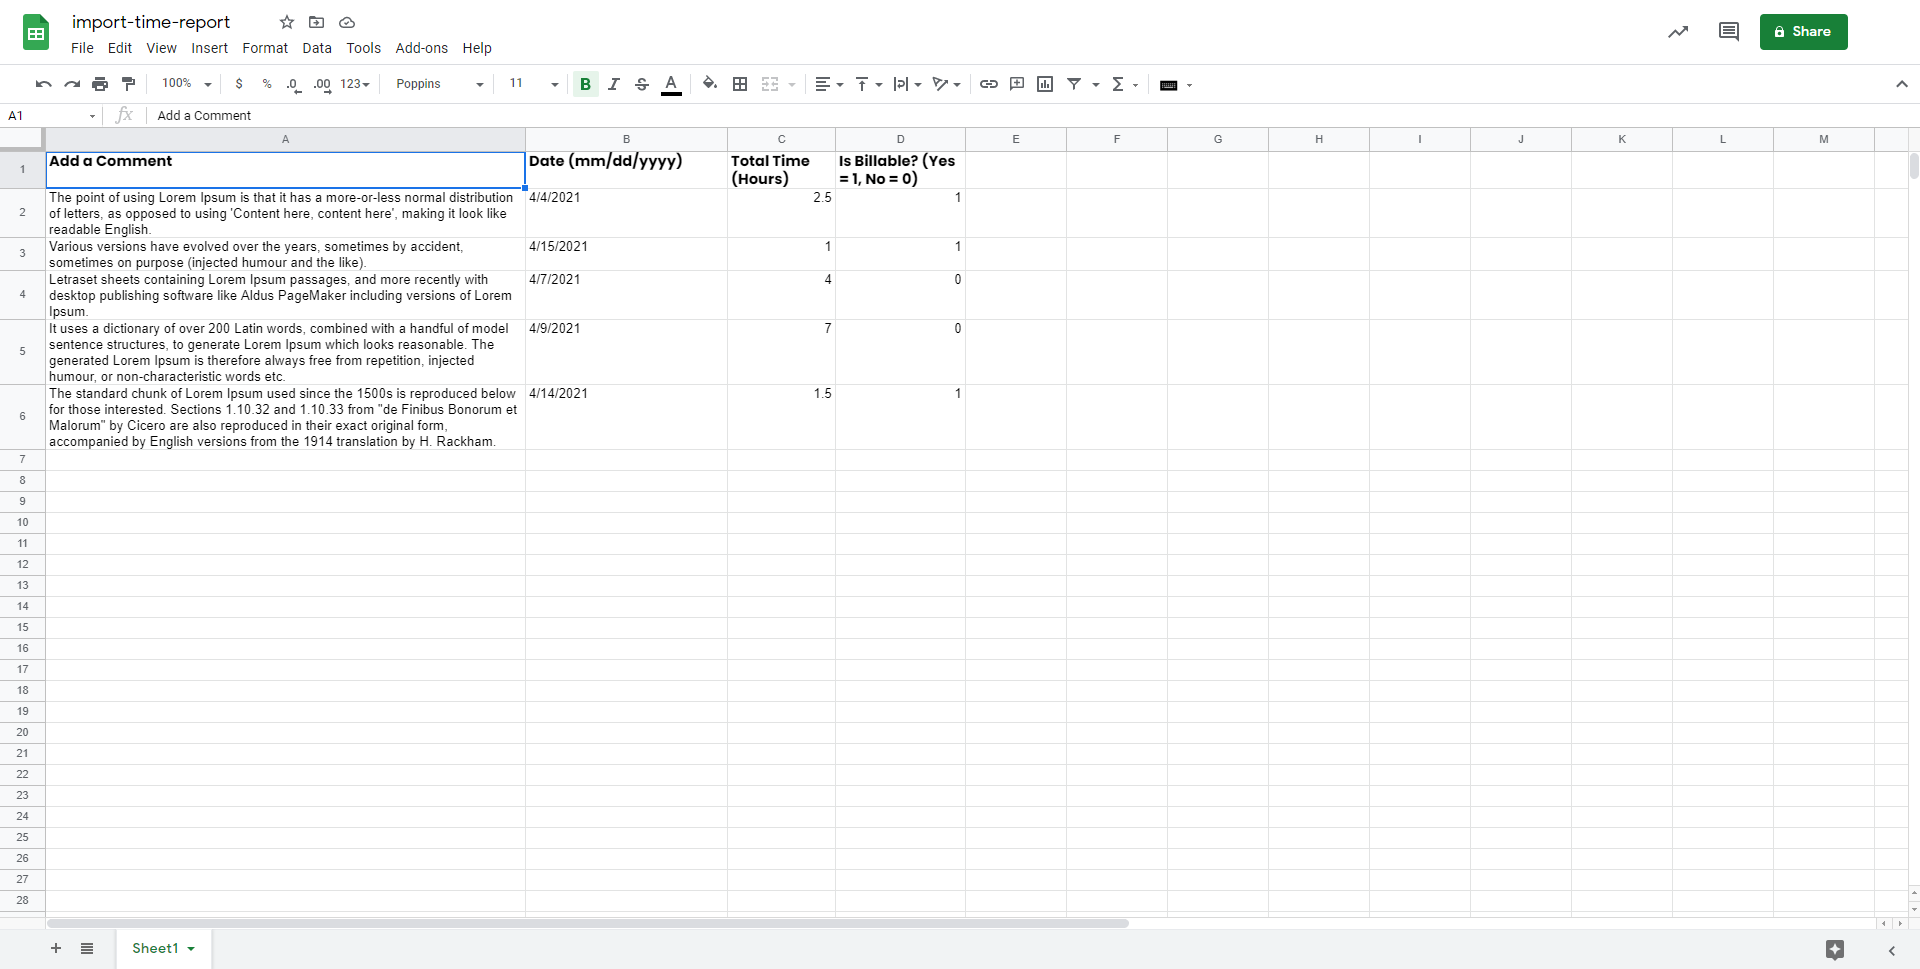
15. In the sample template as shown in Figure 14, the first row should be the column headers. The next five rows from the template contain the sample data.
Figure 14
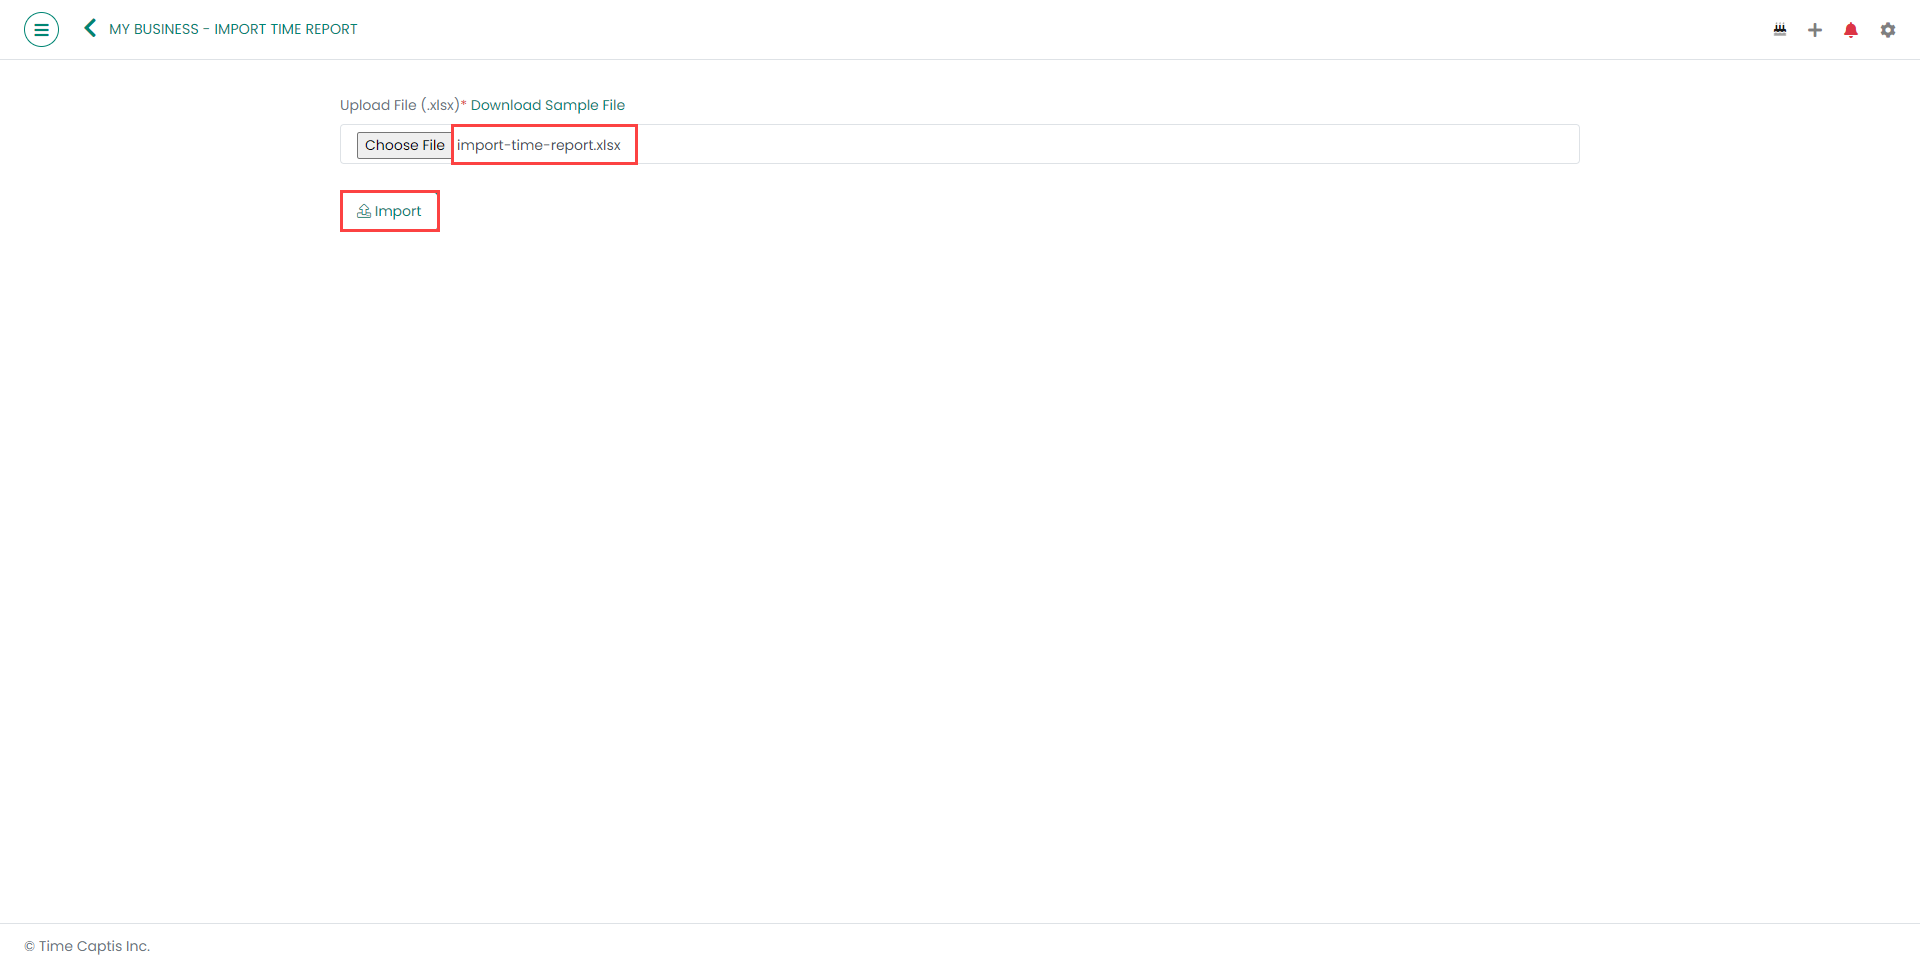
16. Once you have the necessary data in the Spreadsheet, you can choose the file by clicking the 'Choose File' button and import the file by clicking on the 'Import' button as shown in Figure 15.
Figure 15
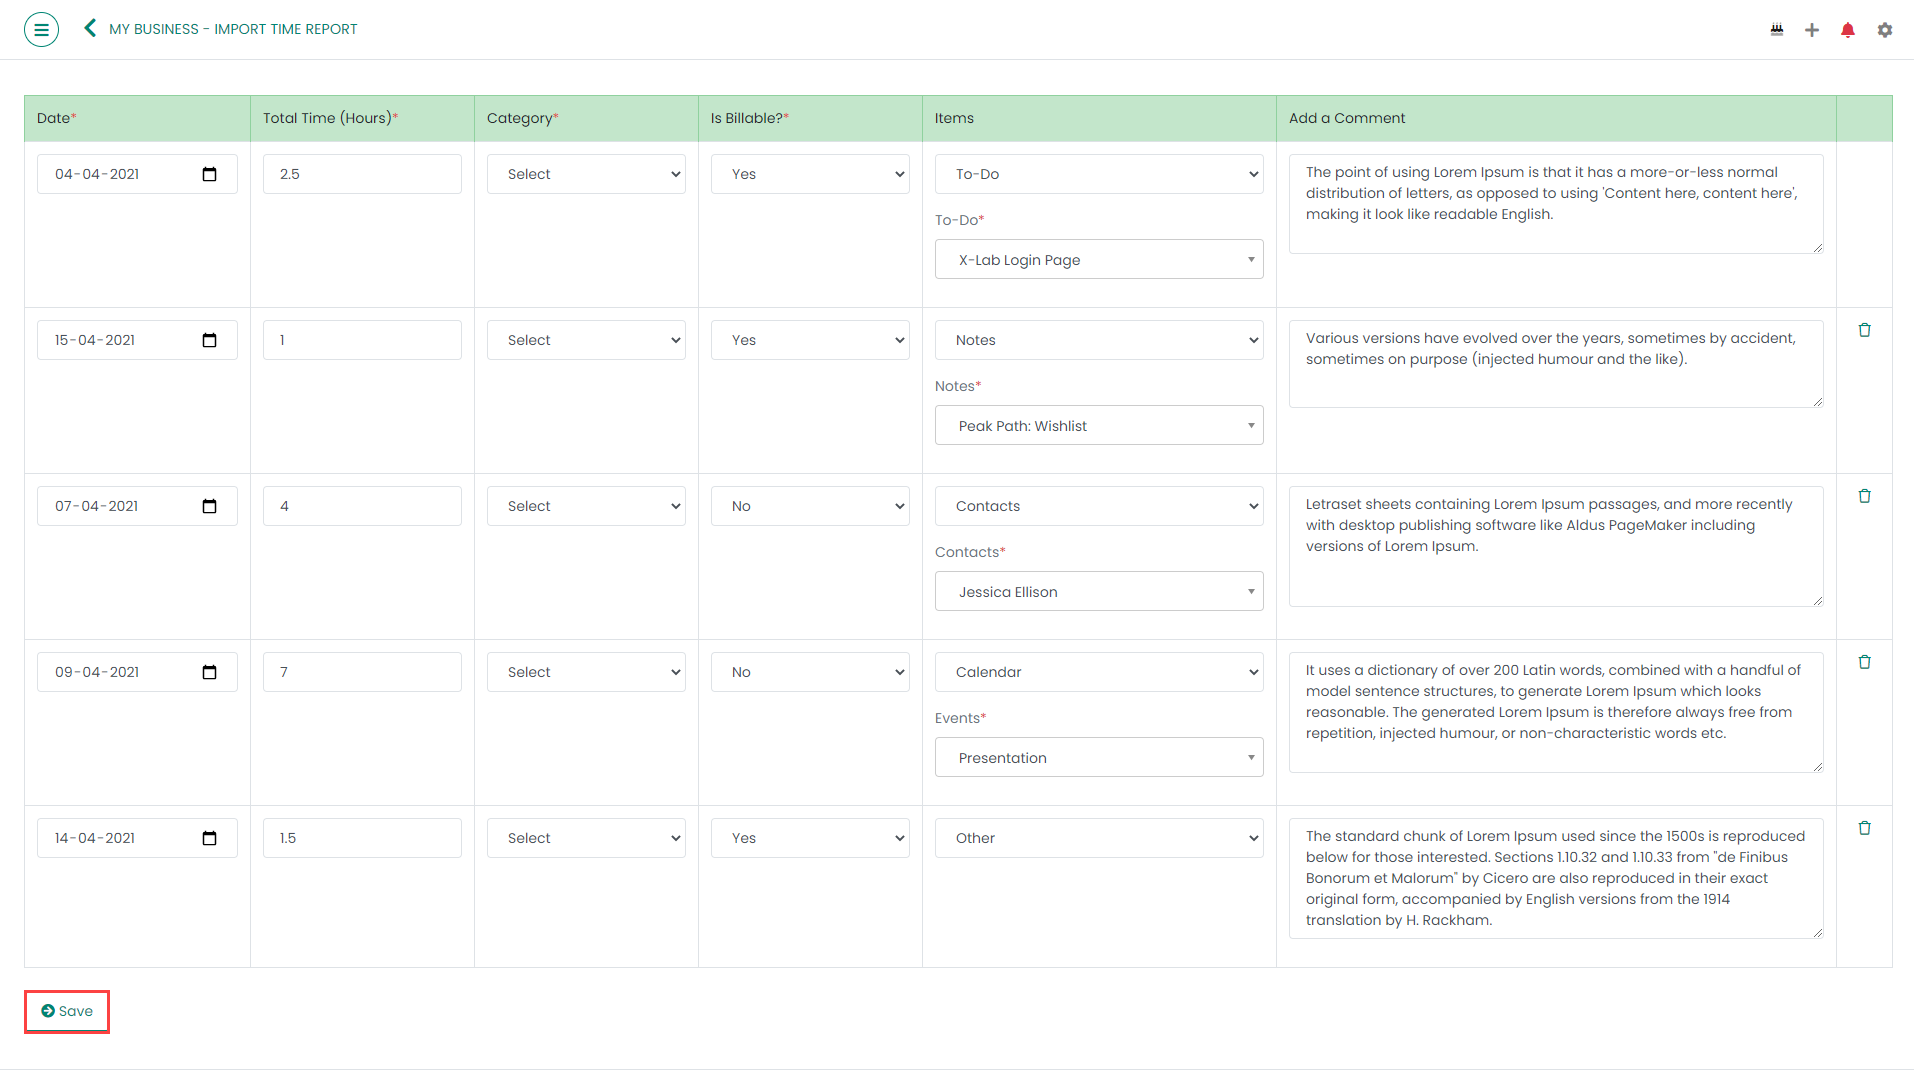
17. After importing the file, the 'Import Time Report' page will appear as shown in Figure 16. Enter the other details and then click on the 'Save' button.
Figure 16
The import will be complete, and your data will be saved. You will also be able to see all the time reports you imported in the Time Report page.
18. To export the Time Reports to excel, click on the 'Export to Excel' button as shown in Figure 17.
Figure 17
19. To add a Time, click on the 'Add Time' button appearing on the Time Report page as shown in Figure 18.
Figure 18
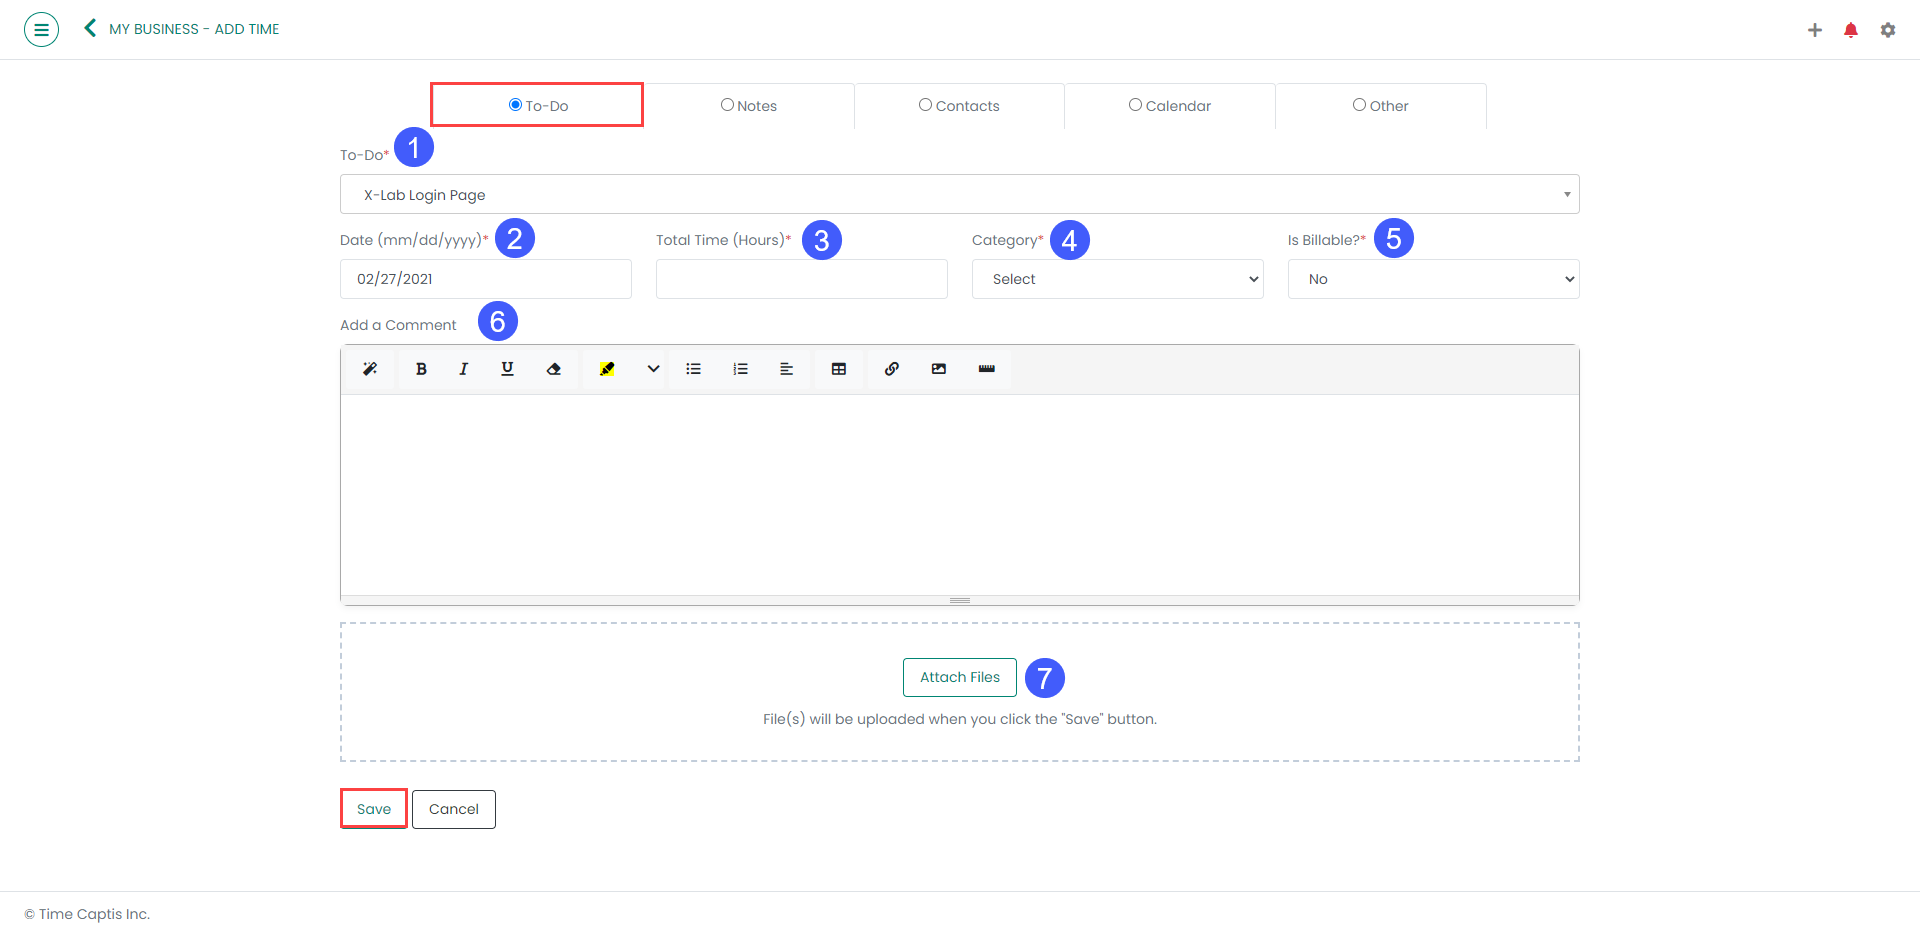
20. Upon doing so, the 'Add Time' page will appear with 5 radio buttons which are 'To-Do', 'Notes', 'Contacts', 'Calendar' and 'Other' as shown in Figure 19. Choose the item for which you want to add Time. Each step shown in Figure 19 is explained in the below table.
Figure 19
Sl. No.
Name
Type
Description
1
Item name
Required
The first added item of the private team will be auto-selected. But, you can choose the item from the drop-down menu
2
Date
Required
The current date will auto-populate here. However, you can still edit the date
3
Total Time
Required
Enter the total time taken in hour(s)
4
Category
Required
Choose a category from the drop-down menu which are appearing according to the team chosen
5
Is Billable?
Required
Choose whether the adding time is billable or not
6
Add a Comment
Optional
Add a comment (if any)
7
Attach Files
Optional
Choose and upload file from your system
Once you are done with, click on the ‘Save‘ button as shown in Figure 19. Upon doing so you can see your recently added Time appearing in the Time Report page for the date you have added.
21. To view a particular added time, click on the said time as shown in Figure 20.
Figure 20
For Team specific time reports, all the users can view the time reports those were added by them only. Only the Admin of the Team can check all the time reports added by the users in the Team specific Time Report page.
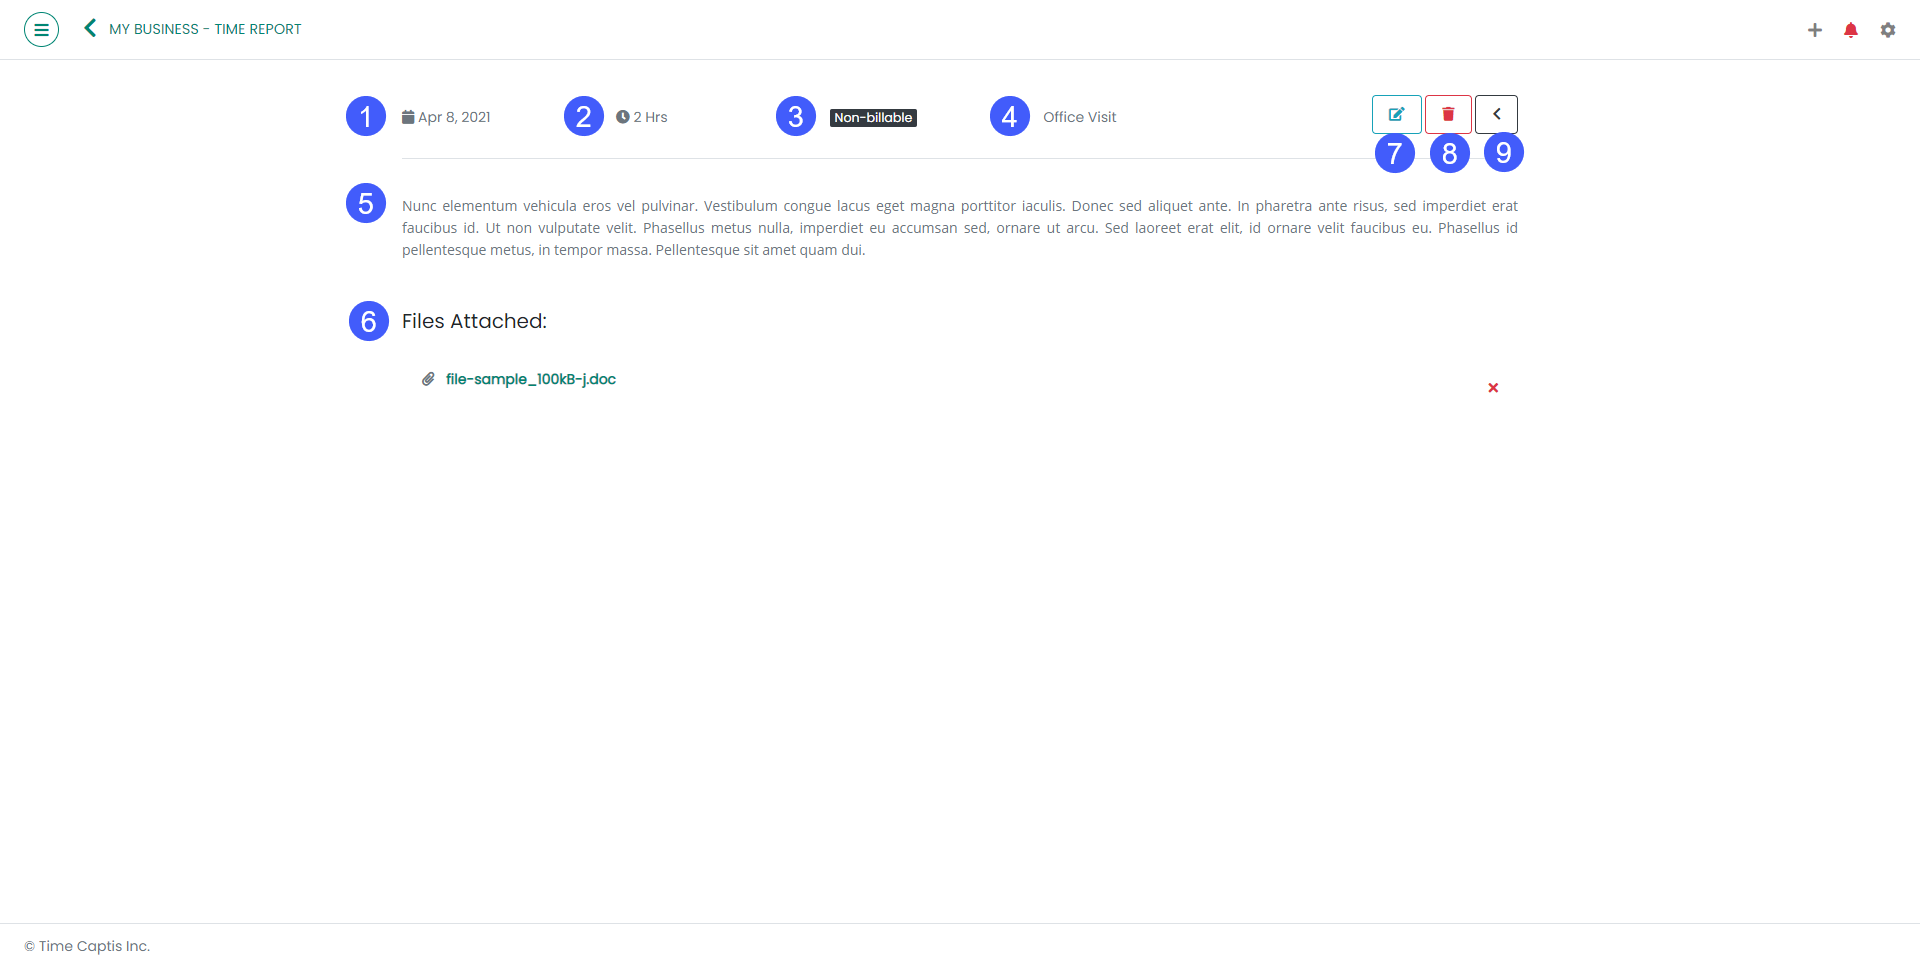
22. Upon doing so, the View Time page will appear as shown in Figure 21. Each step shown in Figure 21 is explained in the below table.
Figure 21
Sl. No.
Name
Description
1
Date
The date on which the time report was added
2
Total Time
The total time added for the item
3
Is Billable?
Whether the added time is billable or not
4
Category
The category chosen for the time report
5
Comment
The comment added while adding the time
6
Files Attached
The files attached in the time report
7
Edit Time
Click to edit the time report
8
Delete Time
Click to delete the time report
9
Go Back
Click to go back to the time report page
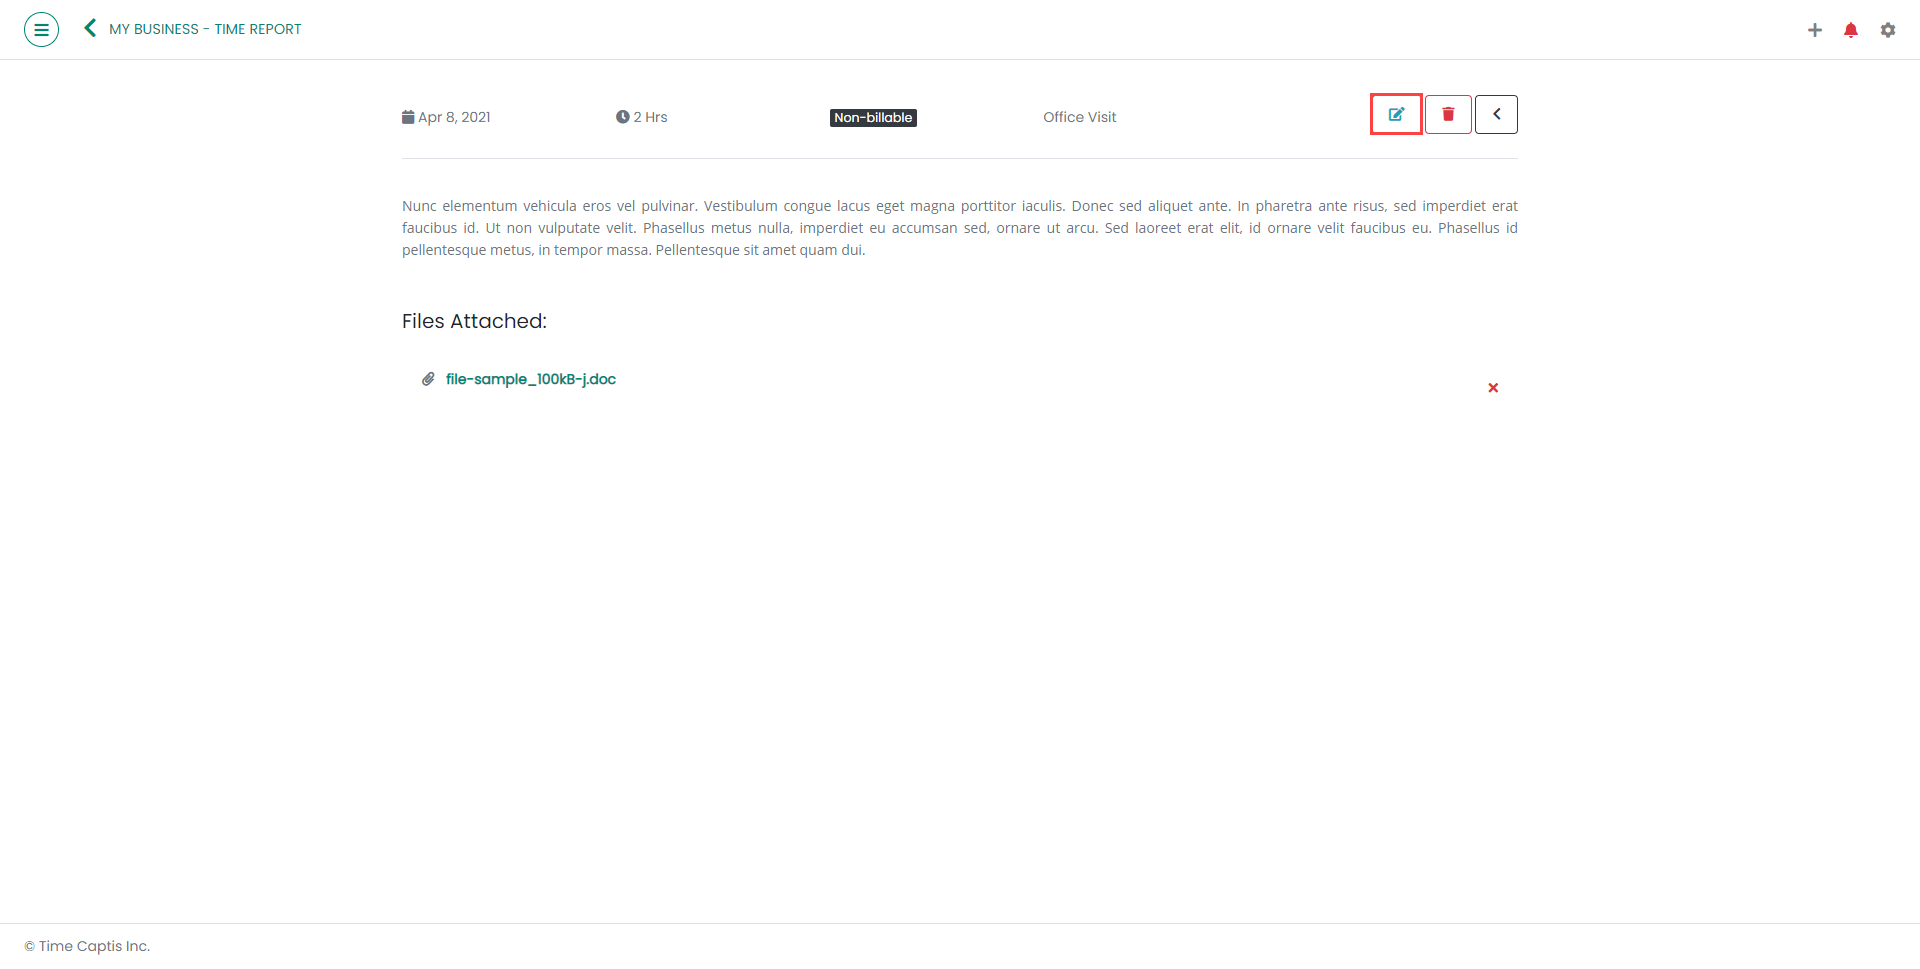
23. To edit the added Time, click on the 'Edit Time' button present in the View Time page as shown in Figure 22.
Figure 22
For a specific Team, the 'Edit Time' button in the view Time Report page will only appear if 'View/Edit' permission is given to the user for Time Report.
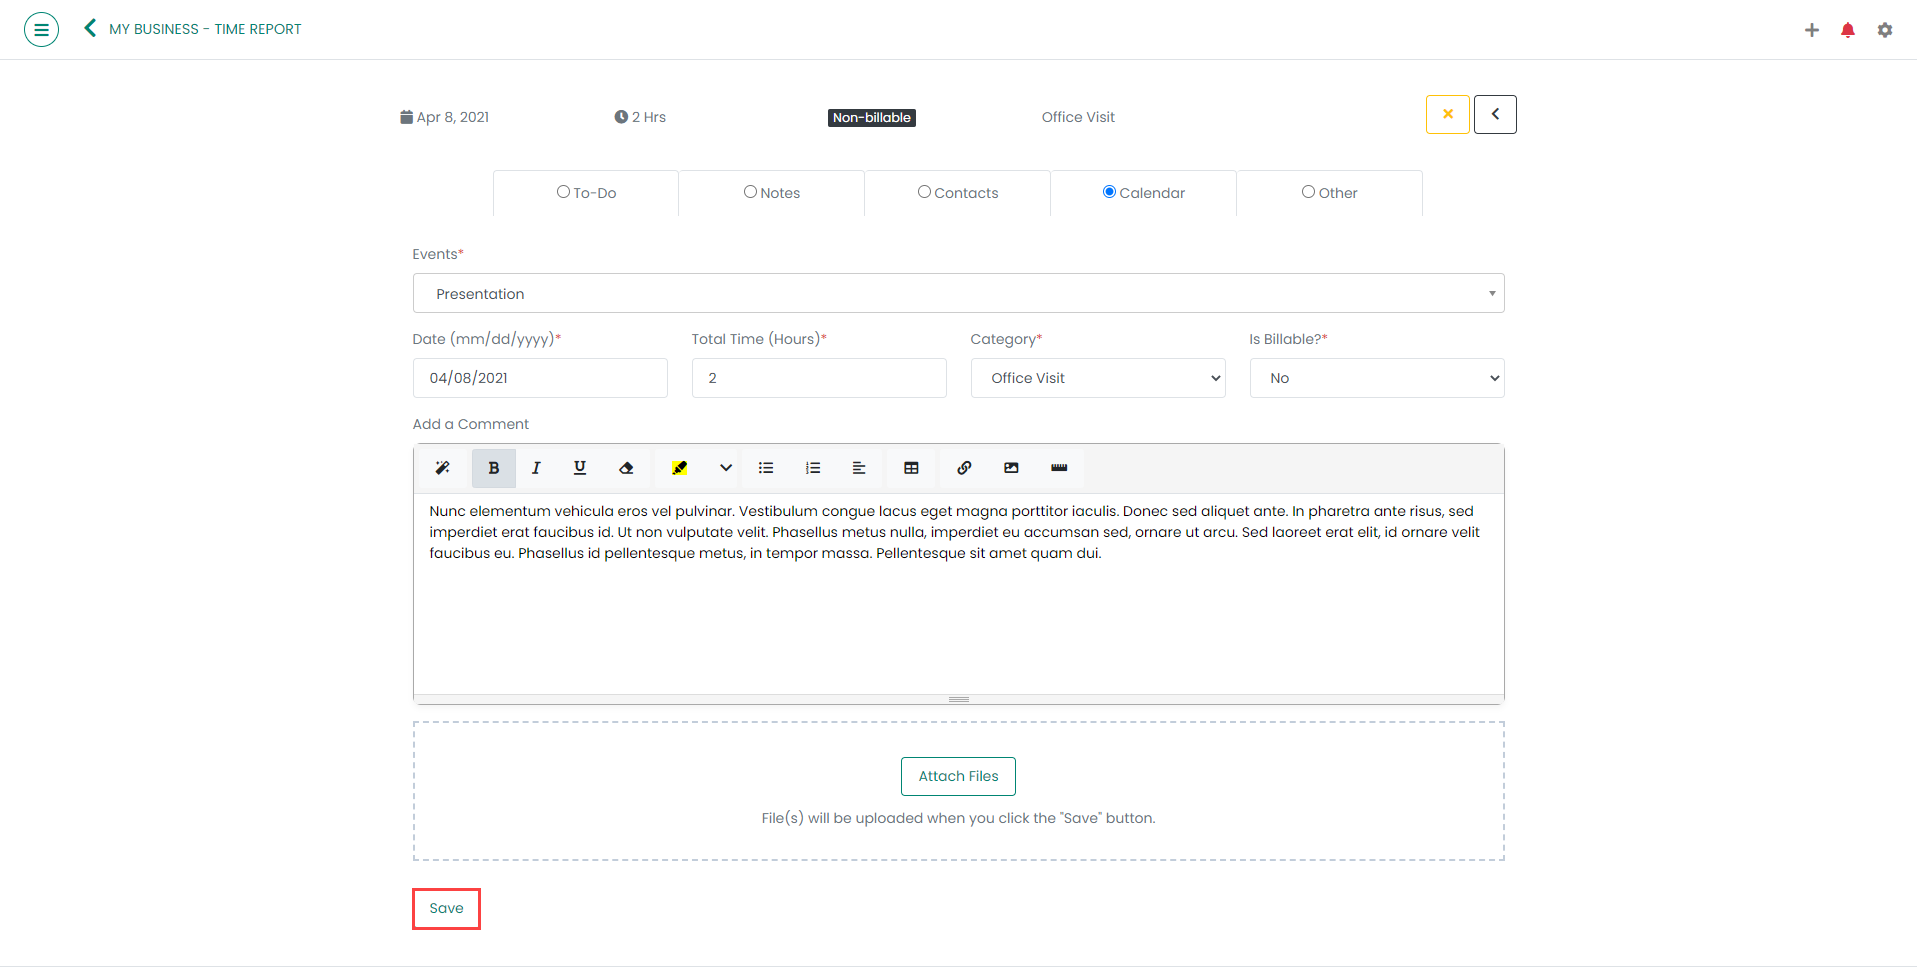
24. Upon doing so, the Edit Time page will appear as shown in Figure 23. Edit the details as per your requirement and click on the 'Save' button to save the changes.
Figure 23
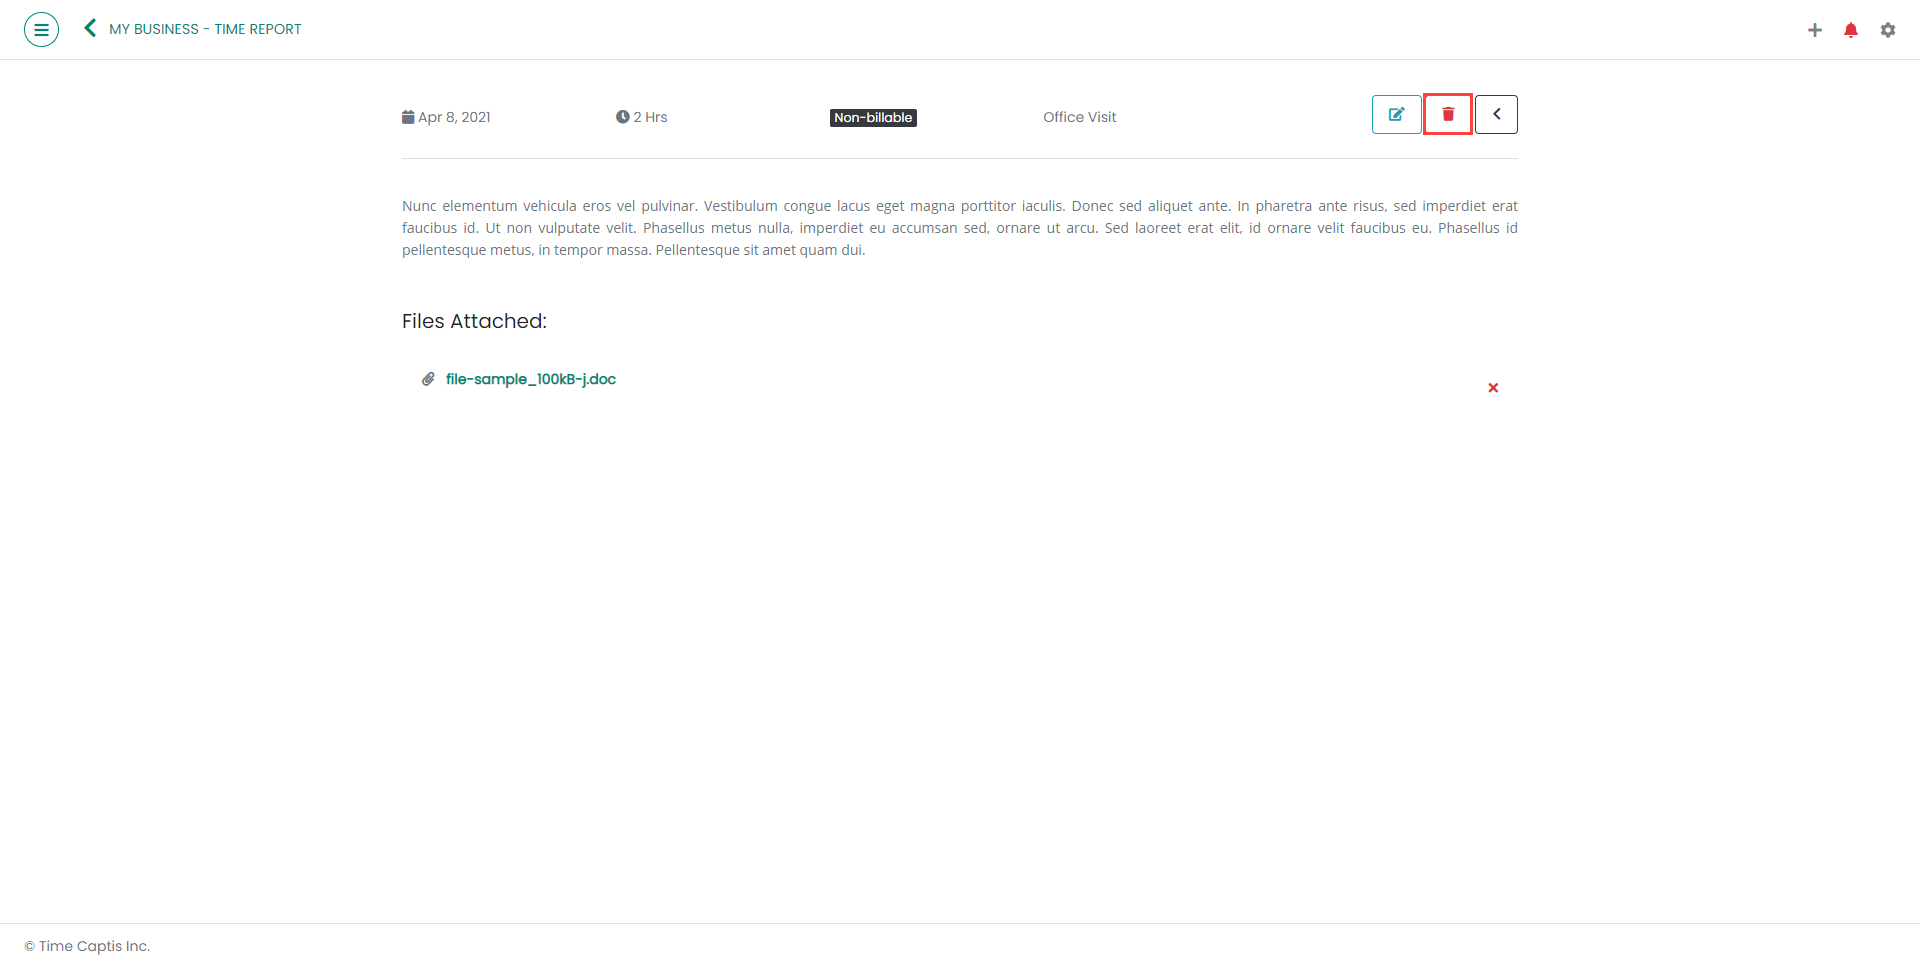
25. To delete the added Time, click on the 'Delete' button present in the View Time page as shown in Figure 24.
Figure 24
For a specific Team, the 'Delete Time' button in the view Time Report page will not be available to any of the Team users except the Admin of that Team.
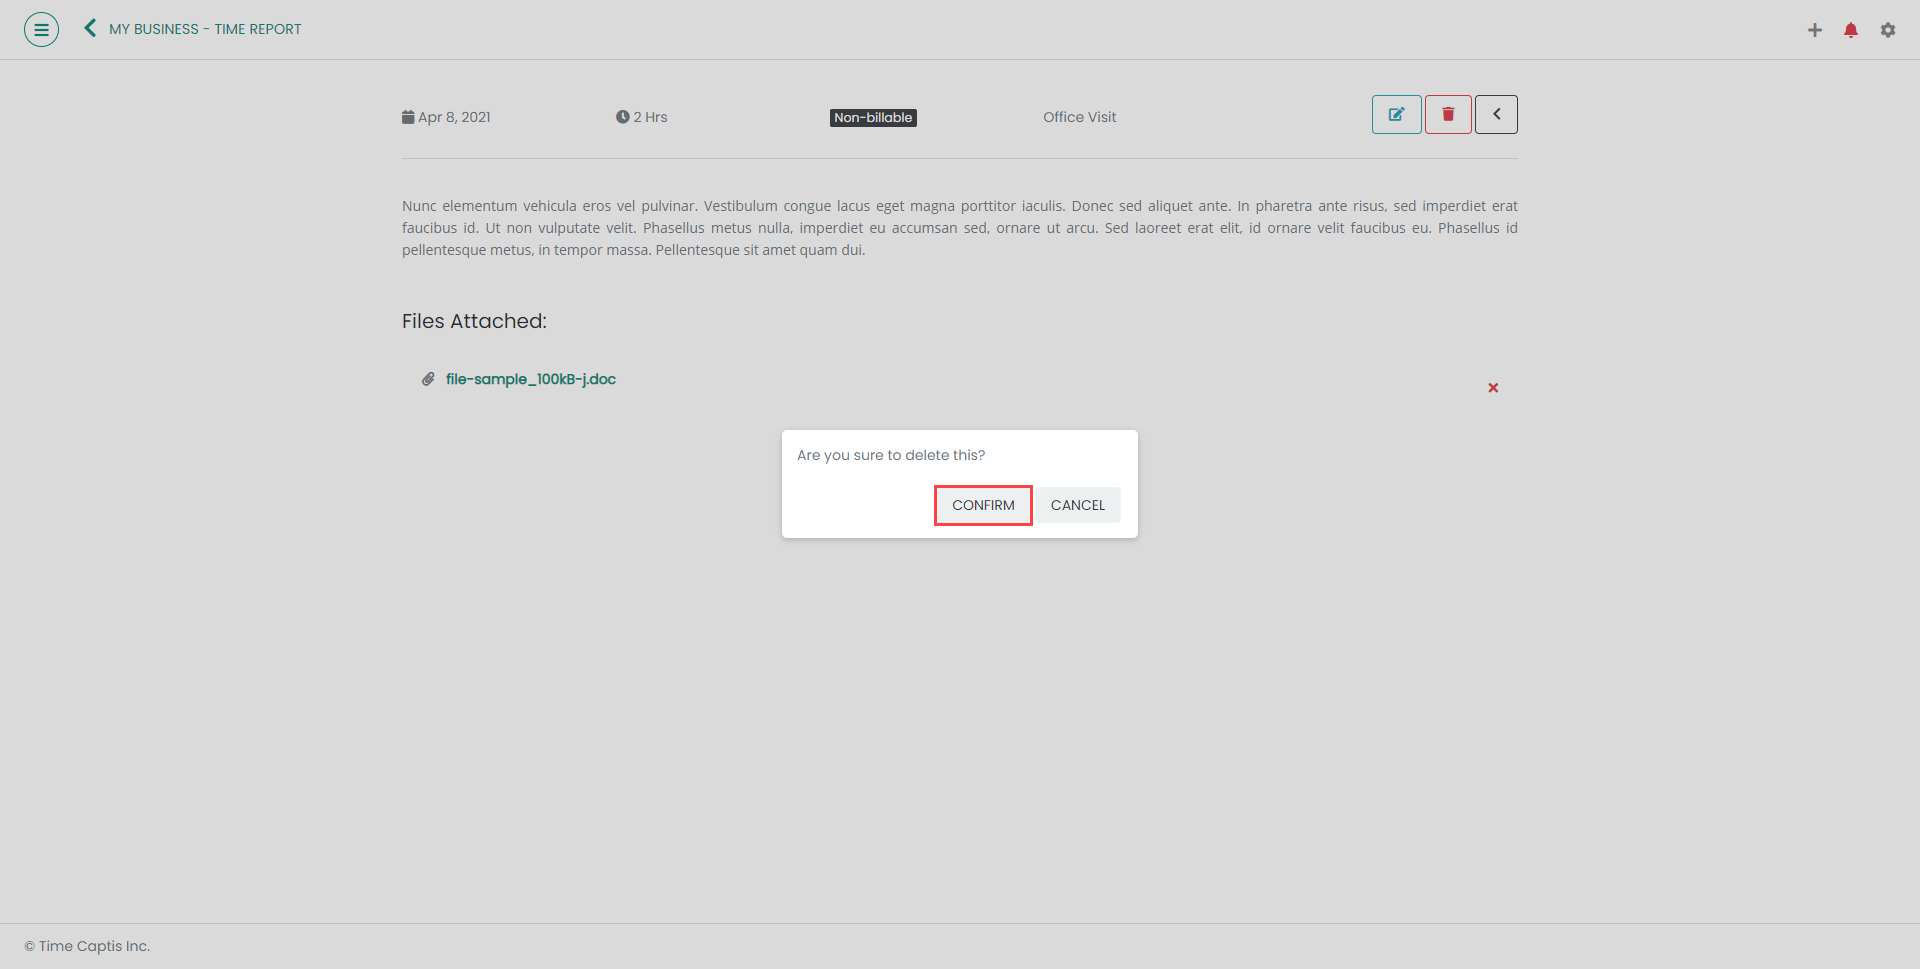
26. Upon doing so, you shall see a pop-up window to confirm before deletion. Click on the 'Confirm' button as shown in Figure 25 and the said Time will be deleted.
Figure 25
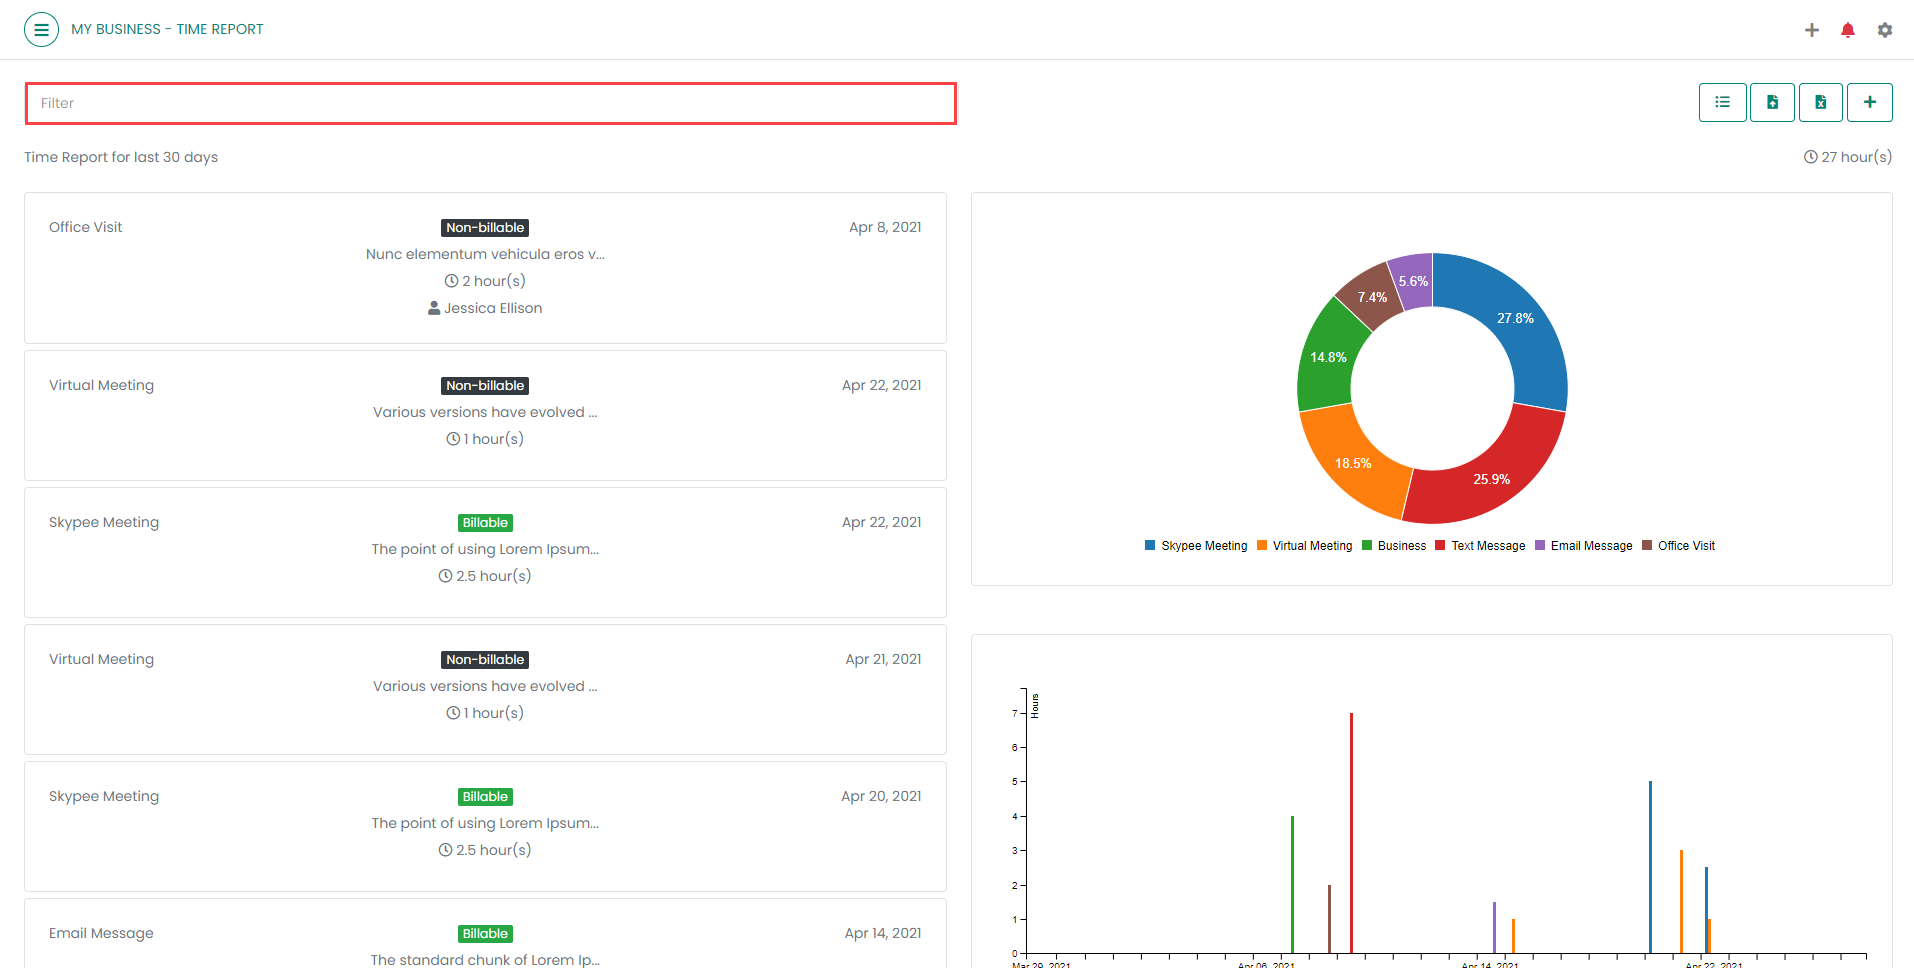
27. To Filter Time Reports, click on the 'Filter ' Text box as shown in Figure 26.
Figure 26
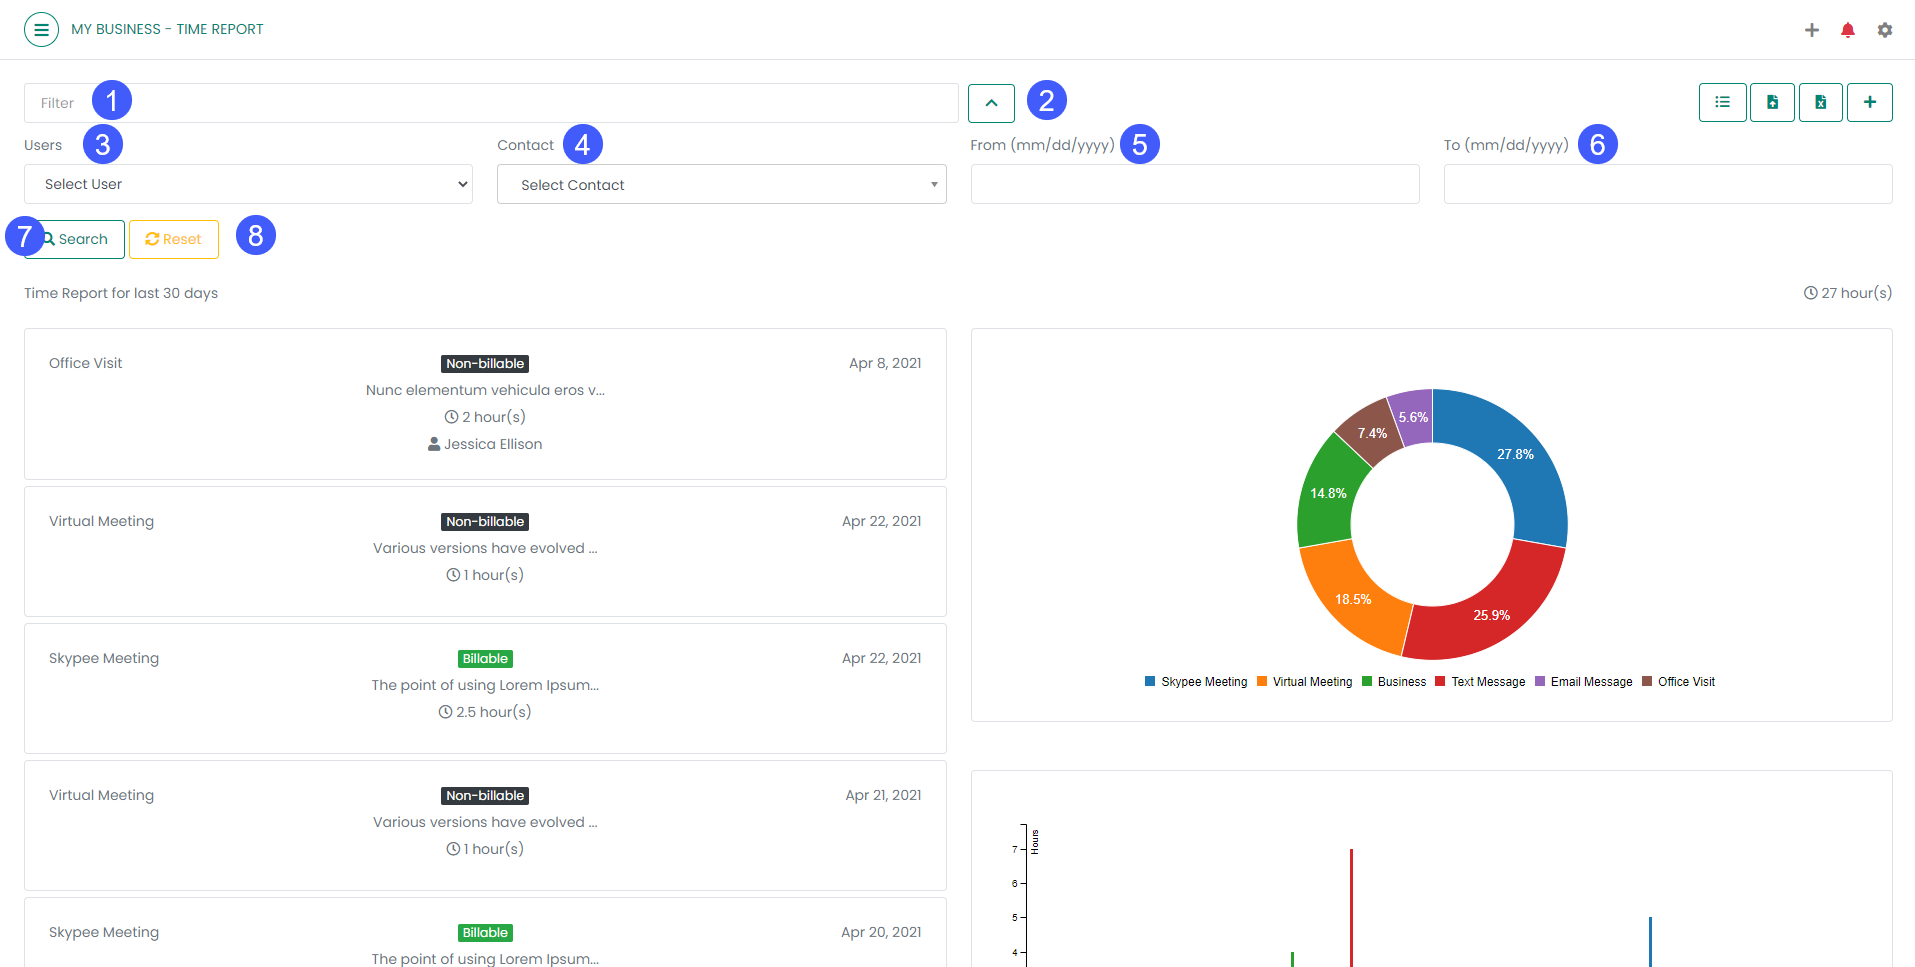
28. Upon doing so, the Time Report page will display the fields for filtering as shown in Figure 27. Each step shown in Figure 27 is explained in the below table.
Figure 27
Sl. No.
Name
Description
1
Title
Enter any item title to be filtered
2
Toggle Up
Click to hide all the filter fields
3
Users
Filter time report by choosing different users from the drop-down menu to track their time. This option is not available for the Private team
4
Contact
Filter time report by choosing a contact from the drop-down menu
5
From
Filter time report by entering a start date
6
To
Filter time report by entering a target date
7
Search
Click to see the filtered result
8
Reset
Click to clear all the search parameters
Manage and track time. Loved by thousands of people worldwide. Trusted by many businesses.
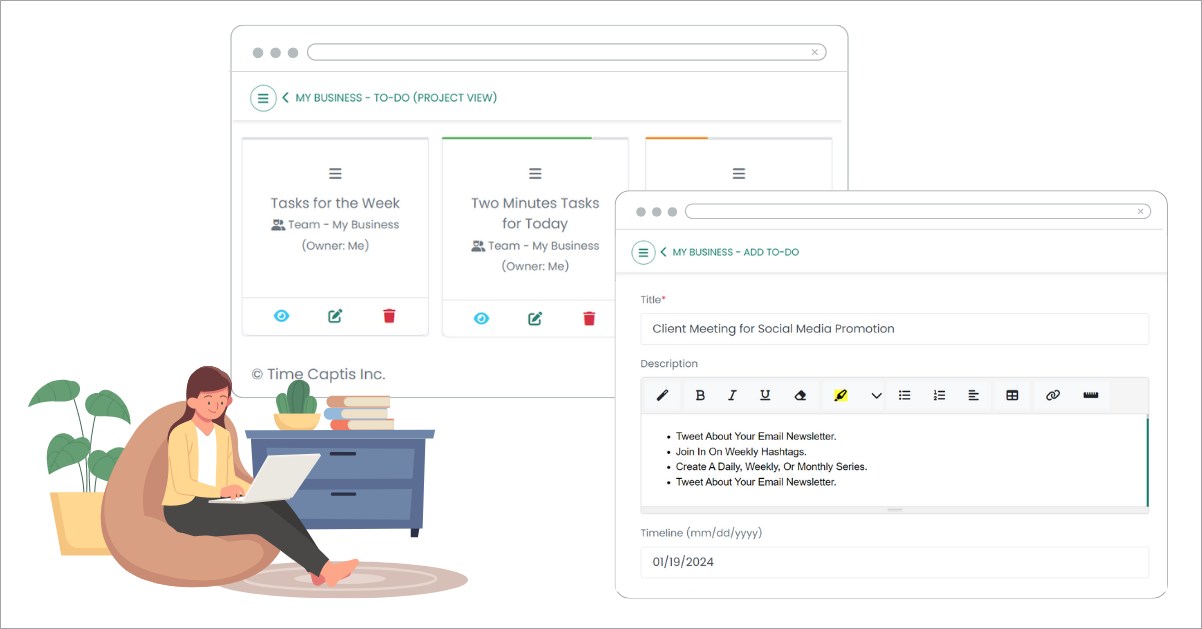
Discover how TimeCaptis accelerates gig work management - from streamlined task management to mobile accessibility, and read real success stories. Perfect for freelancers and independent professionals looking to enhance productivity and client relations in the gig economy. Try TimeCaptis today!
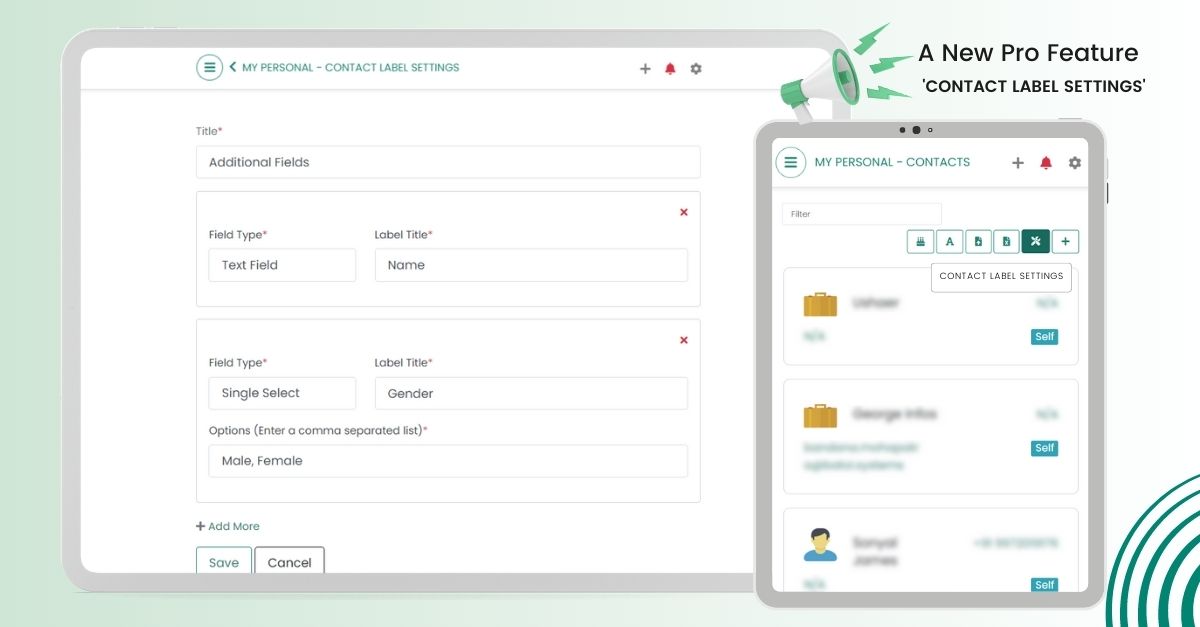
In this blog post, we will explore how custom fields in TimeCaptis can revolutionize your contact management process, enabling you to tailor it to your unique business requirements.
The Pomodoro technique is similar to the time blocking method that tells you to divide your whole workday into smaller blocks separated by small breaks.